About two weeks ago I wrote (slides included) about my talk at the Dutch Citrix User Group (DuCUG) where I presented about troubleshooting the FMA. I also mentioned that when we do have to deal with CTX Support, and note that I’m not trying to sound negative here, we need to understand what to do when we are asked to inventory our Sites or to (CDF) trace certain components / modules for example. I also went into a bit more detail regarding CDF traces and the accompanying modules and trace messages that come with it, including some of the steps we can take to interpreted the collected data ourselves. That’s what I’d like to discuss in this (short) two part series as well, let’s have a closer look at Scout, CDF tracing / control, some of the FMA services (PortICA) etc… I’ll start out with some of the basics and take it from there.
I’d like to discuss the following:
Part one:
- Scout prerequisites
- Basic configuration
- CDF traces / CDF control
- Modules and trace messages
- The FMA services / PortICA
- Reading / parsing CDF Traces
Part two:
- Scout vs. CDF control
- Remote Traces / data
- Collect & Upload
- Environmental data / Key Data Points
- XDPing and XDDBDiag
- Clear text / verbose logging
- citrix.com / Insight Services
Intro
If you’re the guy or gal who needs to deal with Citrix support every now and again, then Scout and CDF control are two very important tools you need to be, and perhaps are, familiar with. These are two of Citrix’s most used troubleshooting tools. They’re used internally by CTX Support and Escalations Engineers as well as externally by most sys admins out in the field, although chances are that in most cases the latter will be on request of CTX Support as well.
@BasvanKaam Congrats – very good summary of our key tools. Internally we use these everyday, so it is good if external techies do as well.
— James Denne (@JamescDenne) March 6, 2015
Hands-on experience is a must, you need to know not only when and where, but also how to use and apply these tools. This also means that you will need to have a good understanding of the architecture you are troubleshooting and how the traffic ‘flows’ through each component. Being able to support CTX engineers is one thing, but if you’d like to dig in a bit deeper, or perhaps educate yourself, you have various options without needing to contact CTX Support (depending on the issue and impact of course). And besides that, I personally consider it to be a good practice to understand what happens underneath the covers whenever possible. This kind of sums up what I would like to talk about in the next 3500 words or so :)
Scout in a nutshell…
Nowadays scout is an aggregation of tools, a toolset if you will. You have the ability to run CDF traces, to collect and upload data from specific machines, collect Event log information, enable verbose / clear text logging, the ability to use secondary tools like XDDBDiag, XDPING, CDF control etc… All of which we will have a closer look at as we progress. I’ll use various slides from my DuCUG presentation throughout this article, which saved me a lot of time to be honest :) When contacting CTX Support, one of the first things they will probably ask for, is for you to run a CDF trace on your environment while reproducing the issue, if at all possible, so…
Consider it to be a good practice to run a CDF trace on the components you suspect, making sure to include all modules (which is default Scout behaviour so you should be fine there) together with a collect and upload also run from Scout, before contacting CTX Support. It will at least safe you a day or two.
First things first
Although, as XenDesktop 7.x, Citrix Scout is installed on your Delivery Controller by default, you won’t be able to actually perform a CDF trace, or much else for that matter, until you have made sure that certain prerequisites are met. This is what needs to be in place:
- Local administrative privileges on the Delivery Controller
- Local administrative privileges on the remote machines
- WinRM needs to be enabled / configured on the remote machine
- Remote registry needs to be enabled on the remote machines
- File and print sharing needs to be enabled on the remote machines
- All machines need to share the same domain
- .NET Framework 3.5 with SP 1or .NET 4.0
- Microsoft PowerShell 2.0
Basic configuration
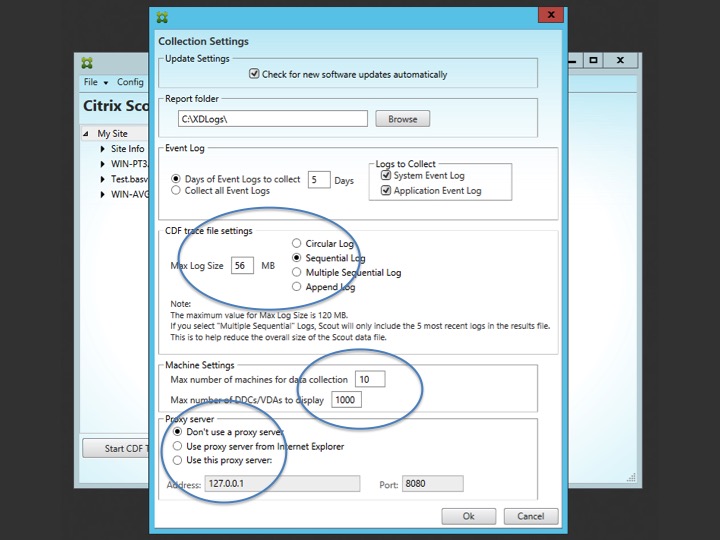
Before we continue, and when we do I’d like to start with CDF tracing, it’s probably a good idea to have a quick look at some of the default configuration settings. Once you launched Scout, click ‘Config’ within the main menu on top left-hand side of the Scout management console. When opened, you’ll see that it’s all relatively straightforward and self-explanatory. The circled sections apply to CDF tracing. Do you use a proxy, what type of logs would you like to collect and how many machines do you want to be able to select when collecting information or running CDF traces? Make your changes and click ok.
Note that the Report Folder C:\XDLogs\ this is NOT the location where your CDF traces will be saved. This location will only be used when you run the Collect and Upload feature. This tends to confuse people.
CDF traces / CDF control
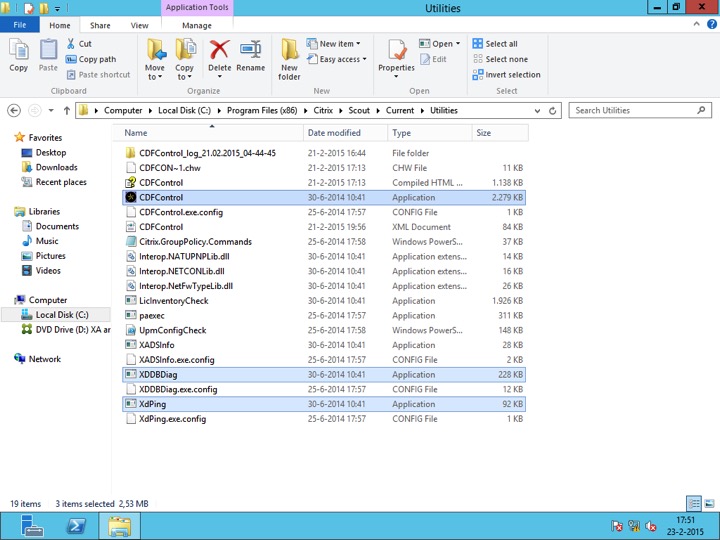
Just so you know… If you have a quick peek in the Scout installation directory, the Utilities folder to be exact, you’ll see that there are several applications listed, CDF control being on of them. See the screenshot below. I highlighted a few applications.
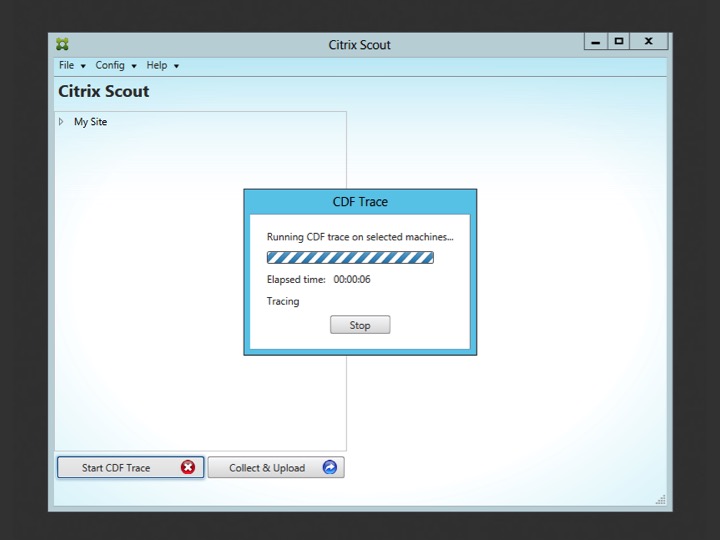
These applications can be started just as if they were downloaded separately and will include all features and functionality that you might be used to, no exceptions. CDF control is an important one; it is used by Scout to perform the actual CDF tracing, locally or on the remote machine. After clicking the ‘Start CDF Trace’ button, one of the first things you’ll do is to select the machines to run the actual CDF trace on. The Delivery Controller from where Scout is started will be selected by default.
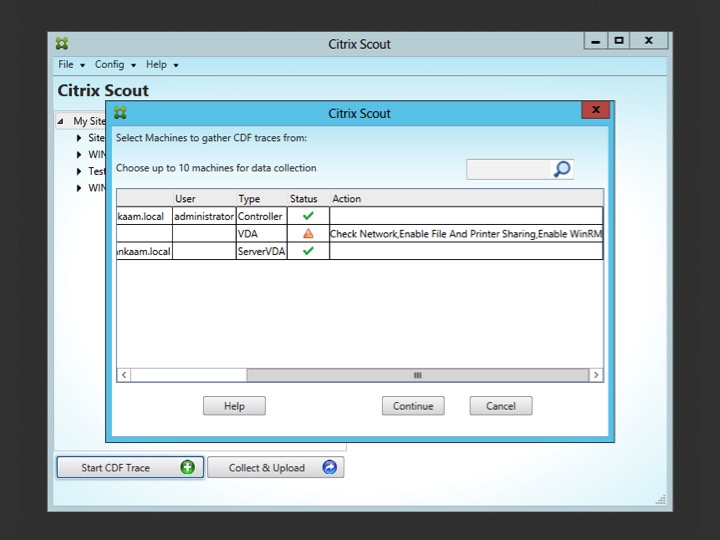
If the selection will include any remote machines Scout will immediately check if it is able to communicate with these machines, this is where some of the earlier mentioned prerequisites come into play. If it runs into any issues while trying to connect it will tell you what is wrong. File and print sharing, WinRM or perhaps Remote Registry need to be enabled on the remote machine. See below.
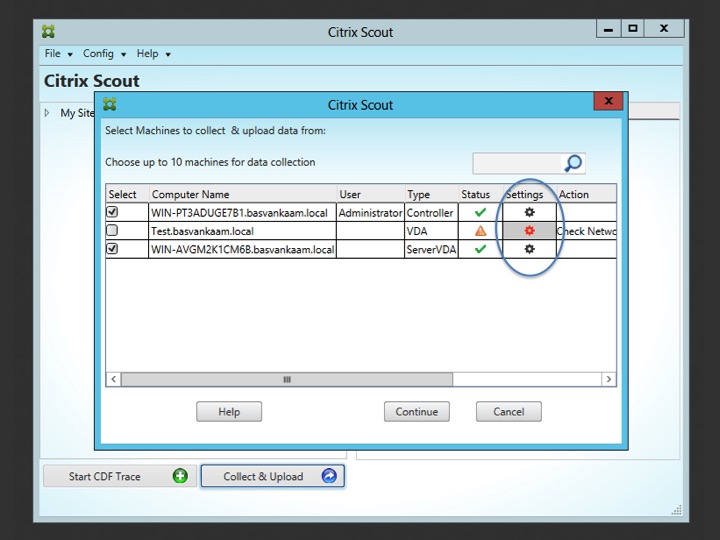
Once these issues are fixed you are good to go and you can click continue which will start the CDF trace. But before we do, I want to quickly show you how to remotely enable WinRM using Scout. Start by clicking cancel in the above screen and open up the Collect & Upload page. Here you’ll see the exact same machine selection including the errors in the ‘Action’ section, see below.
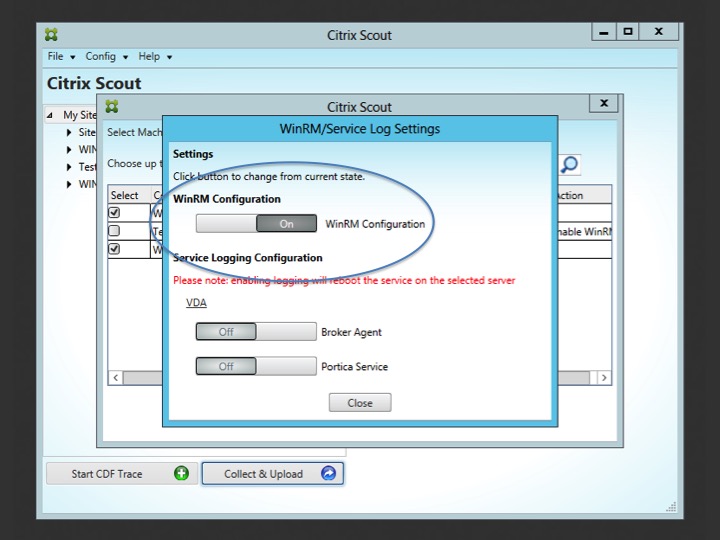
By clicking on the red settings icon a new window will pop up (below). Here you can remotely enable WinRM (circled section). Depending on your scenario this might or might not do the trick. For example, when using PVS or MCS, this will probably be something you would like to configure in the base image and go from there. It will also depend on the type of issue you are troubleshooting.
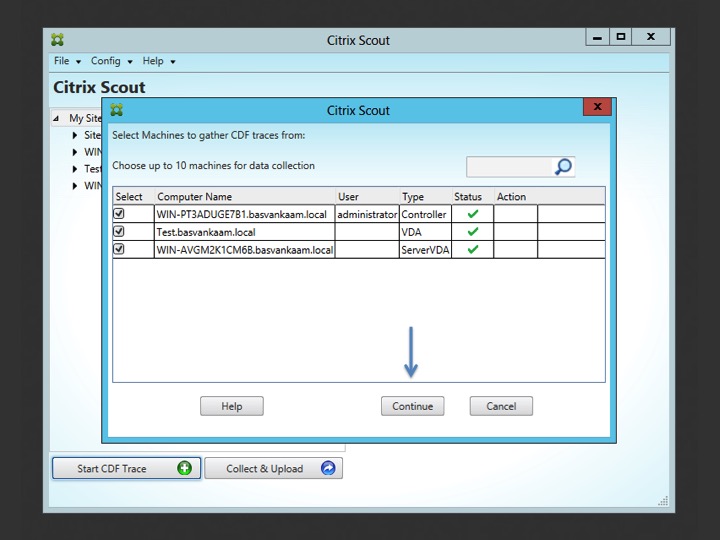
Once WinRM is enabled, and all of the other issue have been taken care of as well (all green check marks) you can hit continue to start the trace. Once you have reproduced the issue (hopefully) and stopped the trace (this has to be done manually from Scout, see screenshots below) the data will be stored locally on your Delivery Controller (don’t worry, I’ll explain where later on).
Remember how I explained that Scout actually uses CDF control to run the CDF traces? What happens is that as soon you click continue to start the trace, CDF control is copied over from the installation / utilities folder, to the remote machine and is executed remotely. Once you click stop, CDF control will be deleted from the remote machine and all collected data will be copied over to the Delivery Controller from where Scout was originally started.
Where does the data come from?
Have you ever wondered how CDF tracing actually works? The mechanism behind it? What kind and type of data gets collected / stored? Let me try and answer these questions for you…
To start, CDF stands for Citrix Diagnostics Facility. There have been some other interpretations of this abbreviation in the past but today this is the one that’s used.
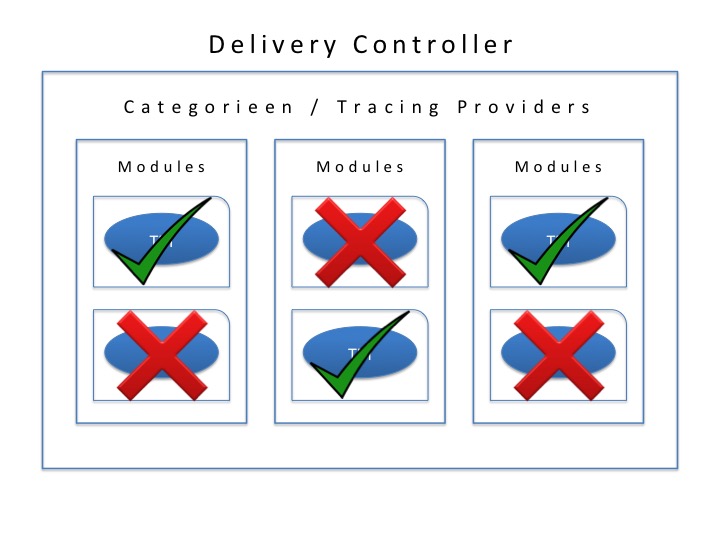
Every Citrix component (a Delivery Controller for example) is split into a certain amount categories a.k.a. trace providers. A category can be everything related to USB, or ICA traffic, printing, FMA services, profile management, provision services and so on and so forth, there are a few dozen in total. These categories are divided into several modules, and these modules consist out of various so-called trace messages.
Now when a CDF trace is ran, again, using Scout or CDF control, diagnostics information is collected by reading the trace messages from the various modules, and this is what actually gets logged as part of the trace. When a trace message gets called upon, or read, it will respond with its current state, which could be an error code for example, telling us what’s wrong.
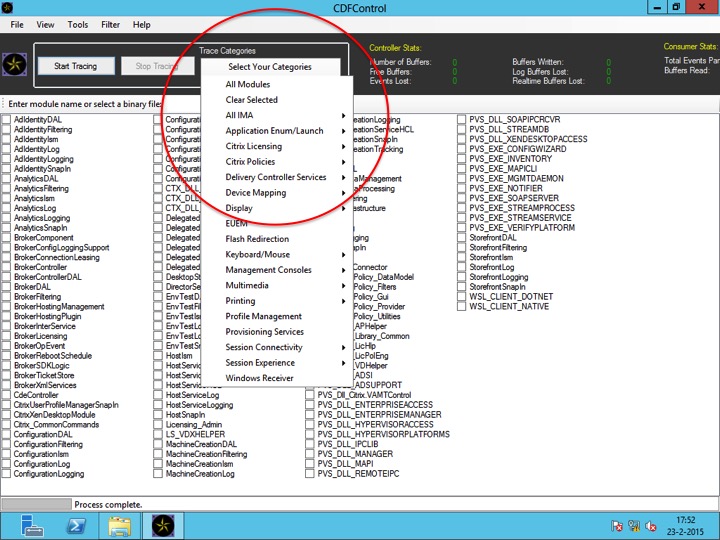
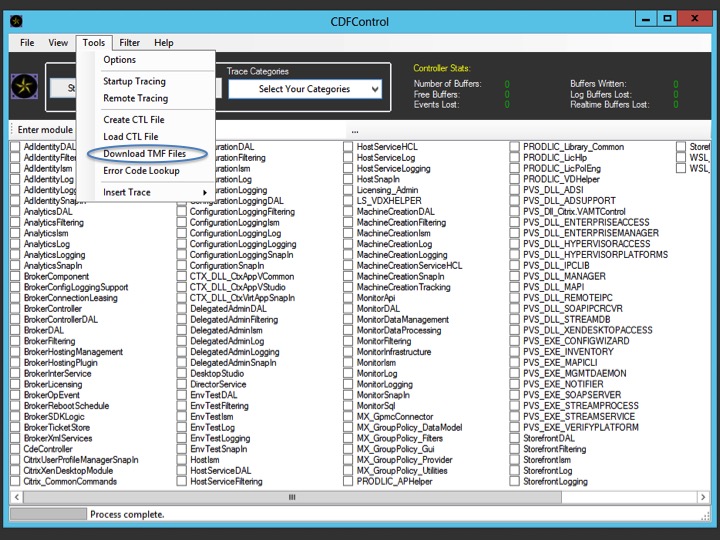
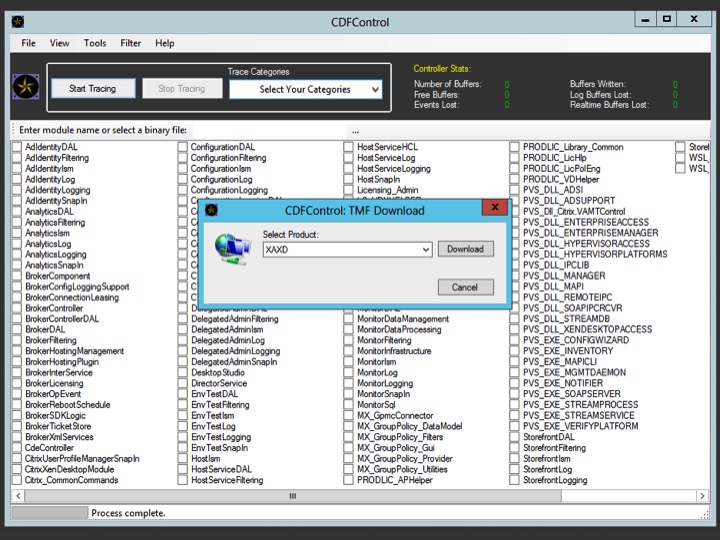
The number of modules, and thus trace messages, per Citrix component will differ. A Delivery Controller will hold a lot more modules / trace messages than a virtual machine as part of your VDI deployment for example. If you open up CDF control on a Delivery Controller you’ll see exactly what I mean, see the below screenshot. I think this is the best I can do verbally :)
This is CDF control on one of my Delivery Controllers in my home lab. As soon as you select a category, the accompanying modules will automatically be selected in the background. If needed you can manually select or deselect your modules of choice. Note that this isn’t possible when using Scout. Scout will scan and read all modules / trace messages that it comes across; this is by design, keeping it simple. Something I’ll address in a bit more detail during part two of these series. I understand that all this might sound a bit abstract, so I tried to visualise it as well. Although it won’t be animated I think you’ll get the general idea.
As mentioned, Scout detects and scans modules, reading the trace messages inside. It uses PowerShell in the background to detect these modules.
Pretty cool right?
Don’t you think this is a cool concept? All this is pre-engineered and build right into every CTX component for troubleshooting purposes only. Although this isn’t a concept thought up by Citrix per se, and there are other vendors who apply these techniques as well, that doesn’t make it any less interesting if you ask me.
The PortICA service / PicaSvc2.exe
When performing a CDF trace, by default, all main FMA services will be included (although you are able to manually exclude services, more on this in a bit) during a CDF trace, all, except for one, the PortICA service.
That’s right, the PortICA service is left out.
Before I continue, it’s important to understand that the PortICA service, renamed to PicaSvc2.exe as of XenDesktop 7.x and also known or referred to as the ICA service, is one of the most import services when it comes to your virtual desktop infrastructure (VDI).
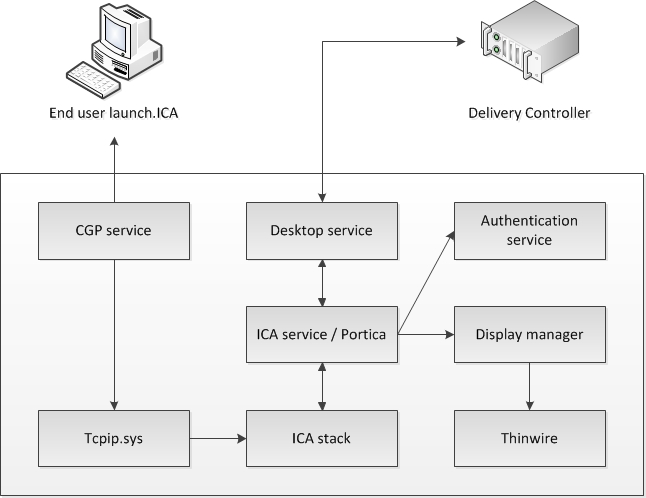
It ‘lives’ on your desktop OS based VM’s (VDA’s) and it takes care of almost everything that is going on the VM except for direct communication with the Delivery Controller (desktop service). Have a look at the below steps which take place once a users connects up to a VM.
- The CGP service will receive the connection and sends this information on to the tcpip.sys, which will forward it to the ICA stack.
- The ICA stack will notify the ICA service a.k.a. the Portica service (Picasvc2) that a connection has been made after which the Picasvc2 service will accept the connection.
- Then the ICA service will lock the workstation because the user needs to be authenticated to ensure that the user is allowed access to that particular machine.
- As soon as the user logs on to the workstation the Portica service will communicate with the display manager to change the display mode to remote ICA, this request will be forwarded to the Thinwire driver.
- In the meantime the Portica service will hand over the ‘pre logon’ ticket data, which it received from the ICA stack, up to the Desktop service and from there back to the Delivery Controller in exchange for ‘real’ credentials.
- The Desktop service receives the users credentials, which are send back to the Portica service.
- The Portica service contacts the authentication service to logon the user and this is sort of where the process ends.
This is the visual that comes with it:
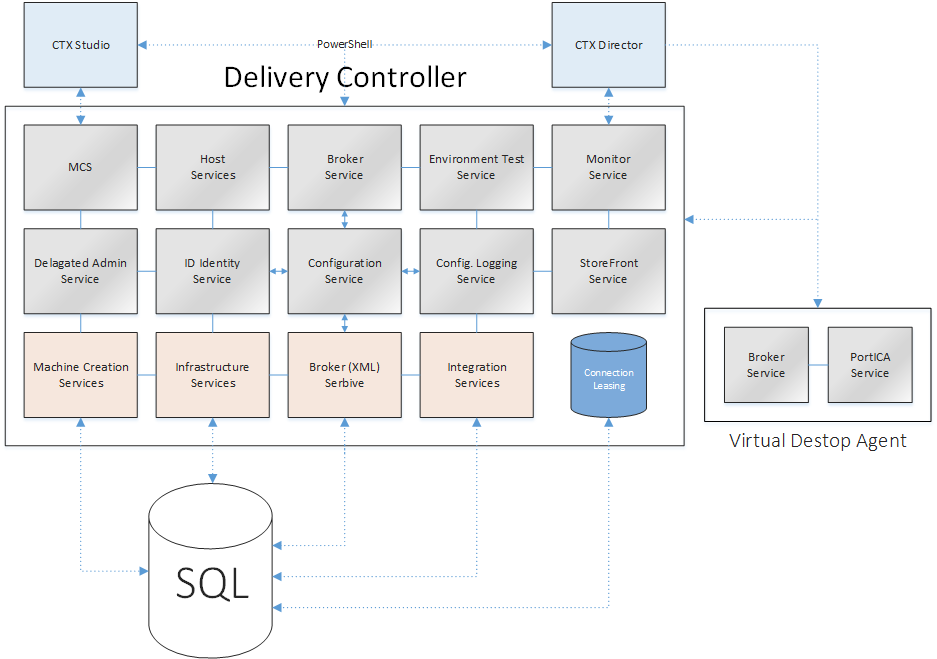
I think it goes without saying that if you are troubleshooting your VDI environment, by running a CDF trace on a desktop OS based VM for example, you want to always include the PortICA service. The same goes for any clear text / verbose logging that you might enable. Fortunately we can enable the PortICA service by hand to be included in these kinds of traces / logs. Have a look at the overview below (I felt like doing some more Visio). It clearly shows all major FMA services (in grey) on your Delivery Controller(s) and your VDA’s (desktop VM’s).
For now I won’t go over all services individually, if you want some details on this (a lot more) I’d suggest you read my ultimate Citrix XenDesktop 7.x internals cheat sheet! Just note that I put the Configuration Service in the middle, since it’s probably the most important one of them all. Or like a wise man once said (not that long ago actually)…
All other FMA/XenDesktop services need to register with the configuration service on startup so that it knows they are all good to go. Or in the words of Mr. XDTipster: It is the glue that sticks FMA together!
The actual process
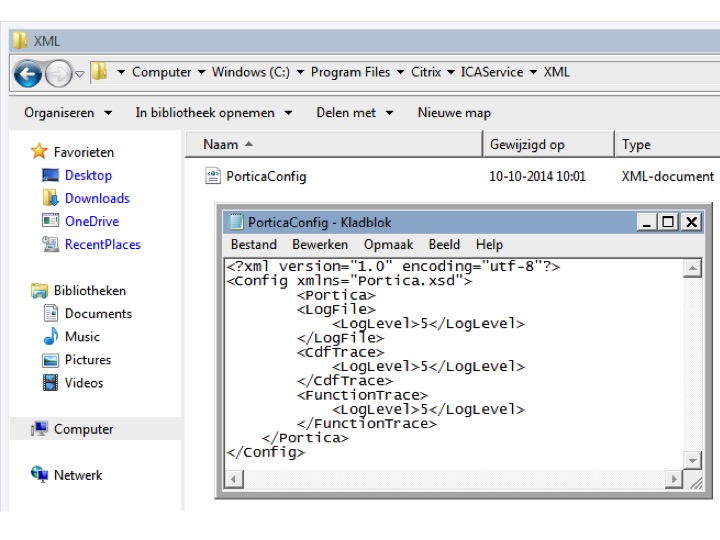
PortICA logging can be enabled in two ways; the first one is by hand. This CTX Doc will tell and show you exactly what needs to done. You will first need to create an xml file (PorticaConfig), copy and paste the content listed, safe it in a designated location etc. just follow the steps listed and you’ll be fine, I probably make it sound harder then it actually is.
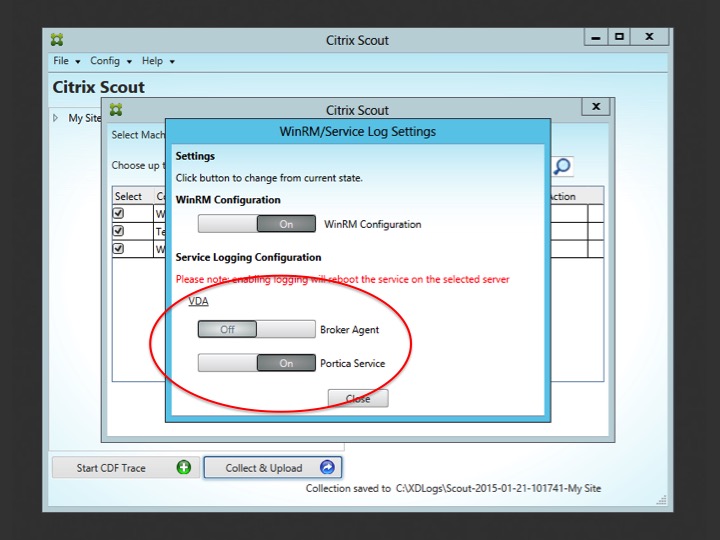
The second method is by using Scout. This will basically automate the above steps for you. There is no difference between the two except that Scout offers you a GUI and you won’t have to manually create, or copy and paste anything. Again, it will depend on the type of issue you are troubleshooting if this will work for you, you might want to enable PortICA logging by hand on one of your base images for example. That would be a judgement call. Anyway, this is how it’s done using Scout. First you go into the Collect & Upload window, find the remote machine where you want to enable PortICA logging and click on the settings icon, like I showed you earlier. After that the below screen will appear and all you need to do is swipe the Portica Service button to the right (On) and you are all set.
As I mentioned, doing it this way will automate things slightly for you. You won’t have to manually create the xml file and so on and so forth, as explained in one of the above paragraphs. However, to give you an idea on how this might look on one of your machines, see the screenshot below. This is the file that has to be created manually, or what Scout will create for you.
Manually excluding certain FMA services
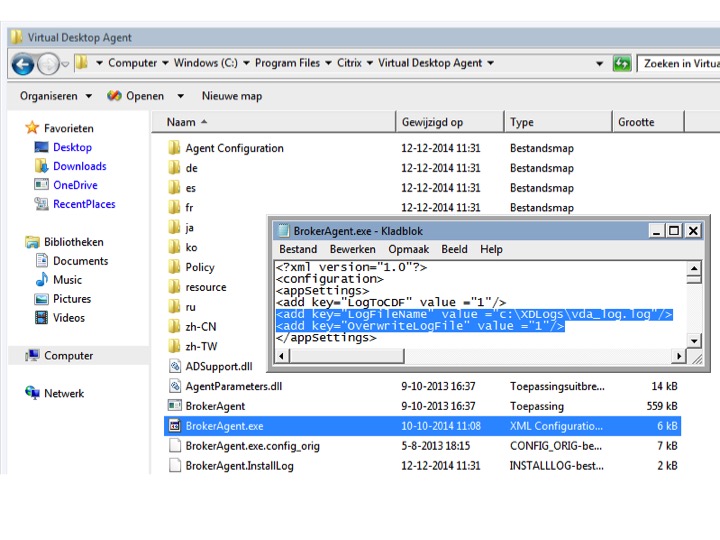
I already briefly mentioned that if needed you are able to manually exclude FMA services from CDF tracing. This is how it works. You first need to find the accompanying xml configuration file of the service you want to exclude. Open it and look for the line: <add key=”LogToCDF” value =”1” /> all you have to do is change the 1 to a 0, that’s all. The below screenshot gives you an idea on how this might look. I used it for something else as well so that’s why the two lines are highlighted, just ignore them :)
 What else is there to tell? Lots!
Ok, back to our CDF trace made earlier. Once you have stopped the trace it will be saved in the following folder: AppData\Local\Temp\Scout\ of the logged on user executing the trace. This in contrary to the C:\XDLogs\ folder displayed in the Scout configuration page discussed earlier. All CDF traces will be saved with the .etl extension.
At this time you could just grab the data, zip it, and send it over to CTX support as (perhaps) requested. Or maybe CTX support isn’t even in the picture yet and you want to have a look for your self, or both. As soon as you open the .etl file, using WordPad for example, you’ll notice that the letters, numbers and other characters displayed won’t make much sense to the human eye.
When a CDF trace is started and the trace messages are read from the modules, the information that gets logged is partly in the form of so called GUID’s. Which means that these (etl) files will first need to be parsed, or translated if you will, before they will make any sense at all.
Trace Message Format files
As mentioned, the .etl files first need to be parsed before they become readable. To be able to this you’ll need at least two things, first, a tool that is able to do the parsing for you, and secondly, you will need to obtain so called TMF files which hold the instructions for parsing and formatting the binary trace messages generated by Scout and/or CDF control. As you can read in the below statement / quote, TMF files aren’t thought up by Citrix, it’s more of a general approach:
The trace message format (TMF) file is a structured text file that contains instructions for parsing and formatting the binary trace messages that a trace provider generates. The formatting instructions are included in the trace provider’s source code and are added to the trace provider’s PDB symbol file by the WPP preprocessor. Some tools that log and display formatted trace messages require a TMF file. Tracefmt and TraceView, WDK tools that format and display trace messages, can use a TMF file or they can extract the formatting information directly from a PDB symbol file. In the Citrix world we would use CDF control and/or CDF Monitor for this.
CDF control
There are two types of TMF files available, public and private. Public TMF files are the ones we use for personal file parsing. The private TMF files are for CTX Support eyes only. Something to keep in mind.
Public TMF files can be acquired in two ways, you can download them directly from the internet by using CDF control for example, or you can contact an online TMF server, live parsing your .etl files. I would advice to always try and download the TMF files whenever possible. For example, when you try to parse large files directly from the Internet using an online TMF server and the connection fails, or perhaps you are on a high latency line, or the TMF servers are, or go, offline at some point (which isn’t unusual by the way, especially last year there were some serious issues with this) you will have to start all over again. Of course you will first have to wait until the TMF servers are reachable again. Next to that, if you need to parse large traces, this could take a long time when applying the online parse method.
Skills might be needed
It also has to be noted that parsing, and especially reading CDF traces (.etl files), is something not to be taken lightly. With this I mean that although the parsing of .etl files is a relatively easy process, however, the reading of these files is something else. You’ll need some special skills to be able to actually find the error or fault causing your issue. Then again, it could be something you’re into, or perhaps you’re curious and just want to have a look to see what’s in there, or maybe you want to learn more on the subject. All are valid reasons to go and have a peek.
Imagine this…
No imagine yourself digging deep into a CDF trace, you have narrowed it down to just a few specific modules and know exactly what to look for en what is most likely causing your issue, whatever it may be. It could happen that the publically available TMF files are not sufficient and that you need some of the private TMF files to parse a specific part of the trace that will expose your issue. What to do? Correct, you need to contact Citrix Support. Of course in a scenario like this you will probably be finished quickly since you will be able to pin point what needs to be parsed to find out what’s wrong. But still, you’ll need a support contract for this to happen ;)
Getting your hands on public TMF files
Using CDF control is probably the easiest way to download the TMF files and/or to use the online TMF server(s). Have a look ate some of the screenshots below. After you’ve launched CDF control, go to tools and select Download TMF files.
Next you will need to select the type of TMF files needed; select XA/XD and click on Download.
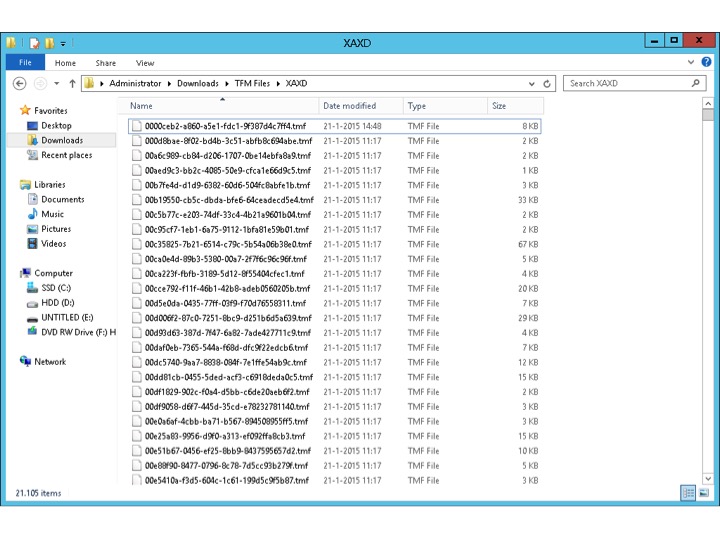
Select a folder to save the files before the download will commence. Once the download finishes the file will look something like this. Due note that it could take a while for the download to finish.
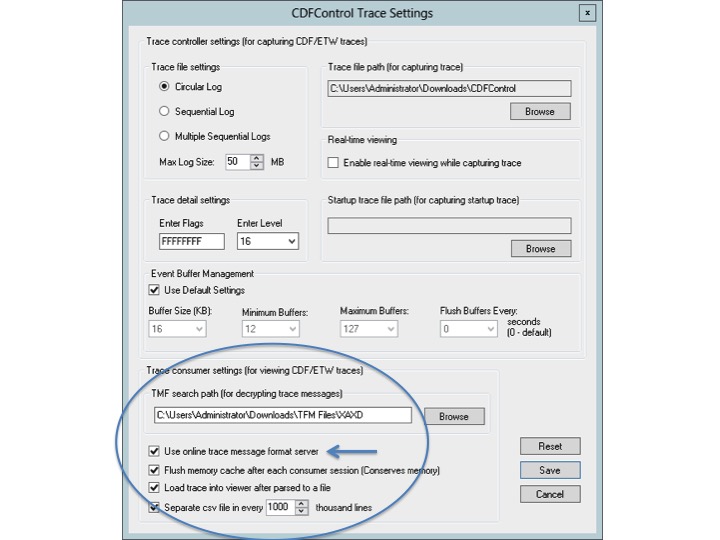
The next step would be to go into the CDF control settings page. Here you are able to select where the TMF files have been stored on your local system or to use one of the earlier mentioned online TMF servers instead (arrow).
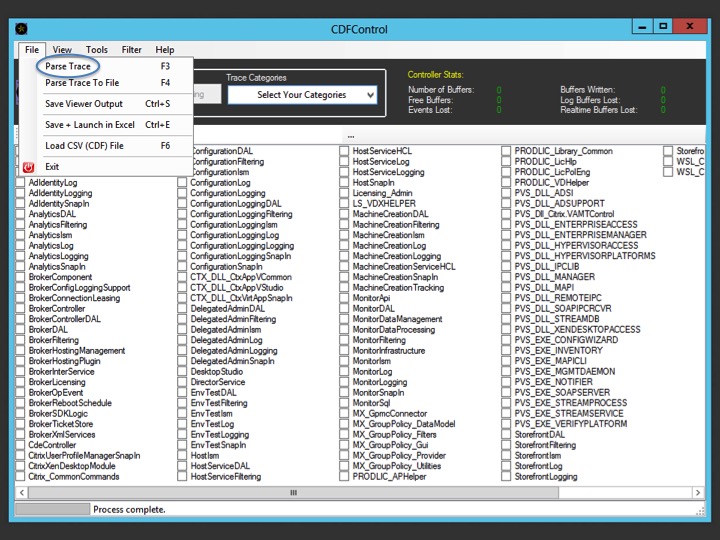
Once configured go back into CDF control and select the .etl file to parse, the steps that follow are pretty self explanatory, so I won’t include all screenshots.
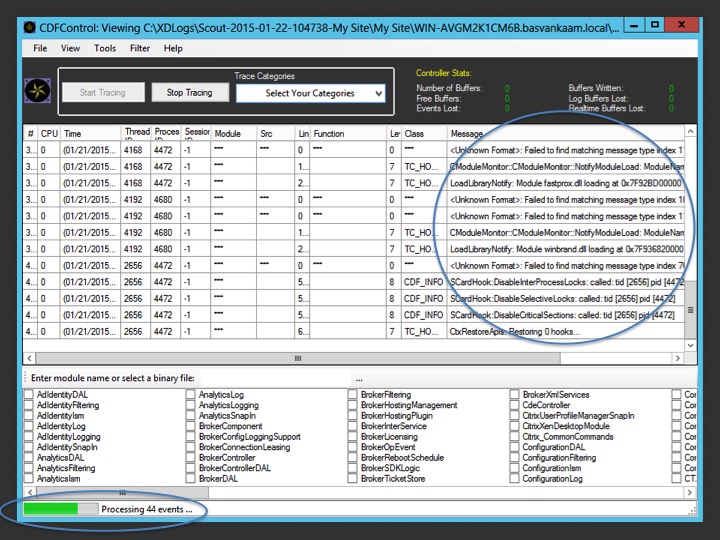
Eventually it will look something like this. You can see at bottom left hand side that the events are being processed and that (more) readable text will be displayed in the right hand side of the CDF control interface. This also shows you that you need to know what you are looking for with regards to parsed information as mentioned earlier. I ran these traces in my home lab whiteout any real problems at that time, so keep that in mind as well. When you are troubleshooting (tracing) a environment with serious issues the output from your .etl files might look somewhat different, and with that I mean, easier to interpret.
Export
During my presentation someone in de audience noted that exporting these results into an Excel file and then filter out all ‘Unknown Formats’ to name one, is a relatively easy and quick way to get a bit more organized (thanks for that). It will definitely clear things up a little, making it easier to browse through you log files. I guess the CDF control interface isn’t the best way to go when actually viewing and searching through your logs.
Filtering
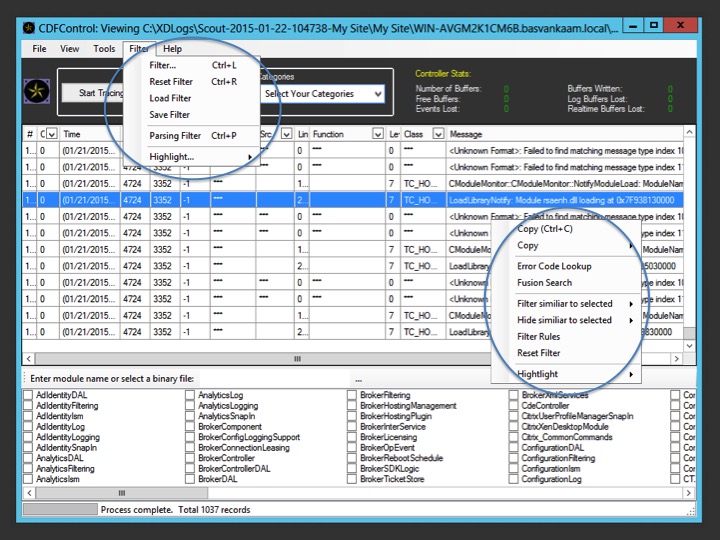
While CDF control might not be the best viewer, it does offer some additional features to make life a little easier, again, if you know what you are looking for. By right clicking on the parsed text or by going into the main mane, CDF control offers some handy filtering options. I’d suggest to just give it a go, open up Scout and/or CDF control, run a few traces and play around with all this a bit. It might not make much sense to you at first but if you stick at it and it has your interest you might be surprised of what you will learn.
That’s it for now
It became a much longer article then I anticipated on forehand, which isn’t a bad thing of course, but I’ll leave it at this for now. During part two I’ll have some more interesting troubleshoot tips and tricks to share with you. I will also provide you with some more insights in how CTX Support handles things on a daily basis. We’ll dive a bit deeper into CDF control, have a look at startup tracing and compare CDF control and Scout as well. Both XDPing and XDDBDiag will be discussed in some more detail and let’s not forget Scout’s Collect & Upload feature combined with Citrix’s Insight Services. Thanks for reading.





5 responses to “Troubleshooting the XenDesktop FMA… Citrix Scout deep dive – Part one!”
Bas, can we use this on older version of XA / XD, such as XA 5 / XD 5.5 ?
Hi Heiry,
I know it also works for XenApp 6 / 6.5. Not sure on the older XD versions though. But it’s a relatively small download so just give it a try :) Let me know how it worked out!
Regards,
Bas.
Bas, sorry to ask this, but I tried to analyze one of my issue. Based on CDF, I narrowed down to these 3 entries. Canyou think of anything? It says ‘reason=refused’ but did not specify why it refused. Appreciate your help!
4106 BrokerOpEvent 4292 16868 1 7/6/2015 10:19:02.969 ****** ?????? *** CDF_INFO 1 2015-07-06T02:18:42.8470000Z:ResourceLaunchFailure(HVD Pool $S1027-2019, Group=e9bb72b3-5113-46db-92a0-7702474e9bd5, Worker=S-1-5-21-317750629-4270190833-1182277681-22008, Session=5a407890-07f8-498d-b645-ae5867ceaa6d, Client=10.25.1.152, Via=10.25.1.158, 46ms, User=S-1-5-21-317750629-4270190833-1182277681-20418, TOKIOMARINEcisrcacc, [email protected], cisrcacc, App=false, Reason=Refused)
4108 BrokerComponent 4292 16868 1 7/6/2015 10:19:02.969 ****** ?????? *** CDF_ENTRY 5 PrepareSession exit: LaunchPrepareRequest[ResourceId=HVD Pool $S1027-2019, UserSid=S-1-5-21-317750629-4270190833-1182277681-20418, RetryKey=, Protocol=HDX, DeviceId=WR_L9Q_Zj53uANhI0C4A, AddressFormat=DnsPlusPort], LaunchPrepareResult[Refused, Address= (IPv6=False), AddressFormat=Dot]
4109 BrokerComponent 4292 16868 1 7/6/2015 10:19:02.969 ****** ?????? *** CDF_ENTRY 5 BrokerXmlLeaseAccess.PrepareForLaunch(HVD Pool $S1027-2019, TOKIOMARINEcisrcacc, EndpointDetails[IP=10.25.1.152, Name=WR_L9Q_Zj53uANhI0C4A, Direct]): Exit (Result: LaunchPrepareResult[Refused, Address= (IPv6=False), AddressFormat=Dot], Elapsed Time: 20080 ms)
No, not really, I would have to dig in a bit more as well, sorry man. Perhaps take the Worker SID, which is the machine the user is connecting to, combined with the User SID and the Session GUID, generate some other log files like PortICA and the Broker Service / Broker Agent logs and then search for the SID’s and GUID mention above. You might end up with some more details. Did you contact CTX support already?
[…] health checks can be done. You can run Citrix Scout and/or Call Home (automated or manually) Smart Check will then analyse the information using the […]