Throughout the last couple of months, I have written multiple posts on Citrix Smart Tools, with a special interest in Smart Check. Have a look here and here. Not that long ago I had a short talk with Mathew Varghese, the Director of Product Management for Smart Tools and Insight Services, which also includes Scout. He told me about, and showed me some interesting features that are coming to Smart Check, not that long from now (Q4).
A short resume
Smart Check is delivered from the Citrix Cloud – it’s cloud only, in that respect. However, it can be used to check on-premises environments as well as any cloud environment you might have, as long as they’re running XenApp and/or XenDesktop 7.6 or above. While Smart Check, together with tools like Scout and Insight Services (which I’ll discus shortly) are ideal to use in troubleshooting scenarios, it’s even better when used proactively to check the health of your Citrix environments.
Smart Check aggregates multiple diagnostics and troubleshooting tools into one. It checks all the main FMA services, Delivery Groups and missing updates for both XenApp and XenDesktop 7.6 and beyond. Though, support for additional Citrix components like StoreFront and PVS are coming, as is support for products like NetScaler, XenServer and more. And while today most of the advanced diagnostics and analytics still come from Citrix Insight Services, the idea is to build all of CIS’s capabilities into Smart Check going forward.
What’s available already
This is what Smart Check currently has to offer: Auto-discovery of XD Sites, Addition of XD Sites, On-demand and Scheduled Checks, Visual UI and Health Reports and Email Notifications. These are all seen and treated as basic features. Next to that Smart Check can also offer Site-centric views and is available with CSS Select.
Advanced features
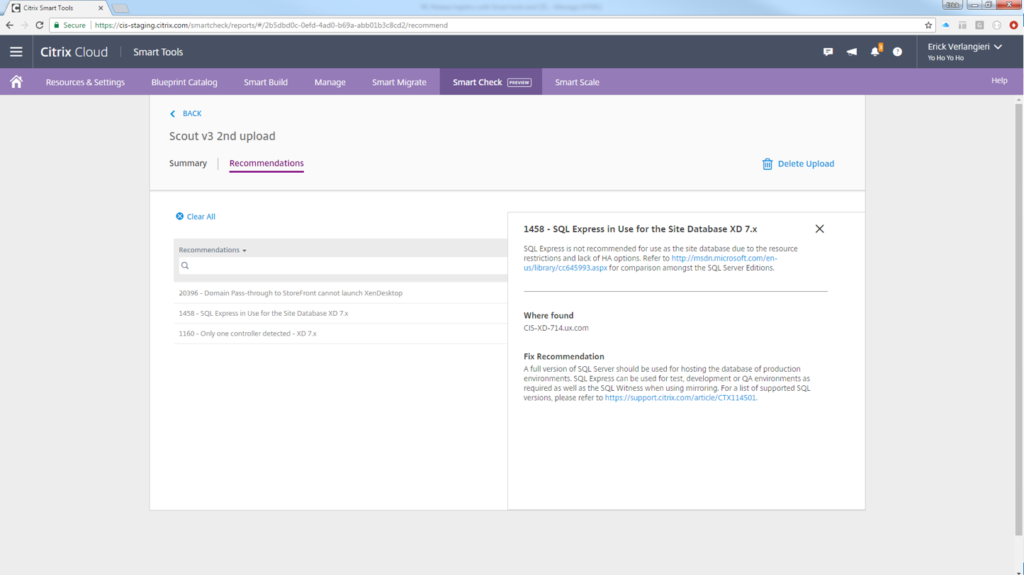
I already mentioned that the complete feature set of CISs’ will be built into Smart Check not too long from now, this will include capabilities like: support for almost all Citrix products, upload services for diagnostic purposes, advanced features for log/trace analyses and bundle-centric view.
The ability to upload key data points (read more about those here) is something that will be available within a couple of months form now. The same applies to building your own custom checks and alerts – more targeted at power users who (can) write their own scripts and tools. Read on, I cover both features (diagnostics upload and custom checks) in a bit more detail below.
Smart Check in more detail
Before getting into creating custom checks and the uploading of collected diagnostic information, let’s first have a look at how Smart Check works under the hood. To start, it is based on four pillars, or building blocks if you will. Here they are:
- Check: Human-readable name representing one or more conditions to be checked.
- Collector: A script, tool, or combination of both for running checks and collecting raw results.
- Analyzer: System that analyzes the results produced by collector and raise/lower alerts.
- Alert: Unit of actionable information. Raised/lowered by analyzer and is a reflection of external condition.
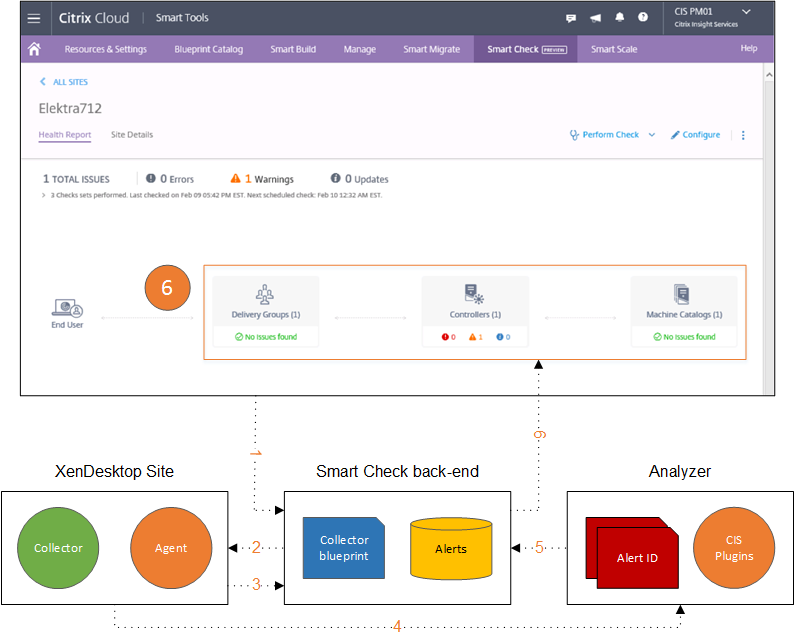
When checks are run, manually or scheduled, the following happens:
- A request is sent to the Smart Check backend which deploys the appropriate collector blueprint to the primary Delivery Controller of the Site.
- Next, the Smart Tools agent on the Delivery Controller, runs the collector defined in the blueprint. The agent also sends periodic updates, on the status of the collector, to the backend.
- The collector runs checks and sends the results to the analyzer (currently this is Citrix Insight Services, which will change going forward). Results vary with every collector – the output is usually a JSON file
- The analyzer evaluates the results and raises/lowers appropriate alerts. All analyzers maintain their own lists of alert IDs and their corresponding states. As mentioned highlighted earlier, the only analyzer we have today is Citrix Insight Services.
- The Smart Check backend invokes the Analysis API to obtain analysis results from the (CIS) analyzer. (API docs – https://info.citrite.net/display/SC/Analysis+API)
- The Smart Check backend displays the alerts in the UI: alerts that were raised are displayed, alerts that were lowered are hidden
A couple Smart Check facts I’d like to share:
- To take advantage of all Smart Check features, you must install the Smart Tools Site Agent on one or more Delivery Controllers in your XenApp and/or XenDesktop Site.
- However, Smart Check can also be used without an agent installed. Manual health checks can be performed. By first running Citrix Scoutand/or Call Home (automated or manually) Smart Check is able to discover your Site by analysing the gathered data. This way it will still be able to display any potential issues and/or update recommendations.
- The visual representation of your Site includes only the components that Smart Check can analyse. Smart Check does not run health checks for other Site components such as StoreFront or Site databases. For Sites discovered through Call Home or Citrix Scout, Smart Check displays issues and updates only for the Delivery Controllers and Machine Catalogs in the Site. Delivery Groups are not included. Also, Site details are not available for Sites without the Smart Tools Site Agent installed.
- If you want to be able to schedule the available health checks to run on your Site, you must install the Site Agent.
Diagnostics uploads
This is one of the first features that will be ported over from Insight Services, or at least it will mirror its behaviour (coming to Smart Check within the next couple of months). A feature most likely to be used on the request of Citrix support, in most cases anyway. It supports diagnostics for almost every Citrix product out there, basically because you will use Scout 3.0 to collect the data – as you might be aware Scout can be applied on just about anything the Citrix product portfolio throws at us.
 Scout 3.0, available as of XenApp and XenDesktop 7.14 has been completely revamped. Not only from a UI perspective, but in the backend as well. If you would like to know more, I have written a detailed blogpost on the new Scout 3.0 release earlier this year, you’ll find it here. In short: machine enumeration had been improved greatly, there are no more limitations on the number of machines to collect diagnostics from, Scout still collects CDF traces as well as AOT’s (though it doesn’t use CDF control anymore, Logman.exe (part of Windows) is now used instead), uploads can be scheduled, and finally, the results can now be viewed in Smart Check.
Custom checks and alerts
As mentioned, custom checks and alerts are targeted towards users how are able to write scripts and/or tools themselves. In short, it comes down to this (have a look at the video below as well) you create a check, followed by an alert, which is optional not mandatory, you run the check on the target machine and finally, if any, you view the alerts in the User Interface. Existing Smart Check features like scheduling and email notifications can be used here as well. Best thing is, it’s completely browser based, no software will have to be installed, at all. Afterwards custom build checks and alerts can also be shared with other customers and colleagues.
Smart Check Fact: Smart Build, also part of the Smart Tool family is used to build the custom checks and alerts. See the video below as well.
Have a look at the clip below, it’s about two minutes and 40 seconds long and shows you exactly how easy it is to create a custom check and alert. All credits go to Matthew – thanks for sharing this man! The video was shown earlier during this year’s (2017) Citrix ServTech in Helsinki. For additional information on creating custom check and alerts go here (manage-docs.citrix.com)


One response to “Heads up! Citrix Smart Check introduces diagnostics uploads and custom checks and alerts – deep dive (and video) included”
[…] Read the entire article here, Heads up! Citrix Smart Check introduces diagnostics uploads and custom checks and alerts – deep di… […]