Version 7.14 of XenDesktop & XenApp comes with an updated version of Scout, version 3.0 to be exact – up from 2.23 before that. As you will find out throughout this post there are a couple of substantial differences between the two. I’ll start by highlighting some of the main features/capabilities of Scout as part XenDesktop & XenApp 7.13 and earlier versions, followed by how this is now handled within version 3.0. I have included a couple of screenshots as well.
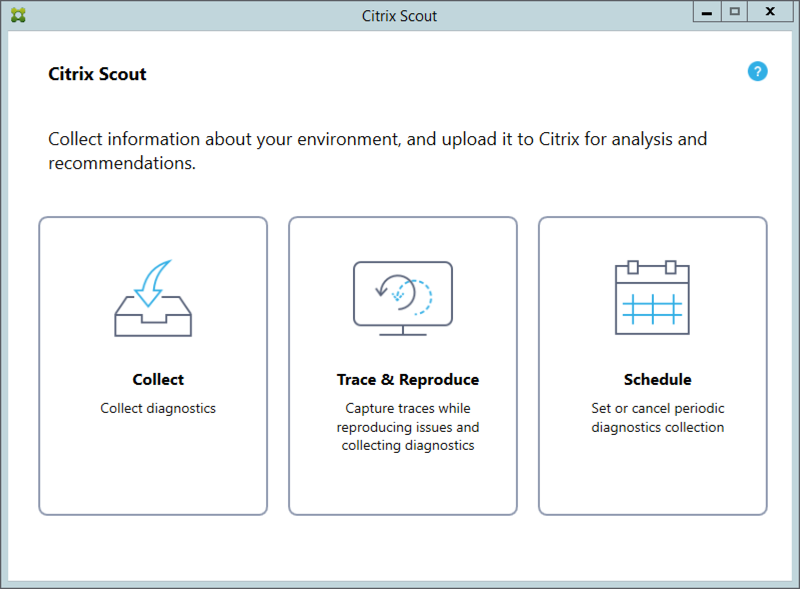
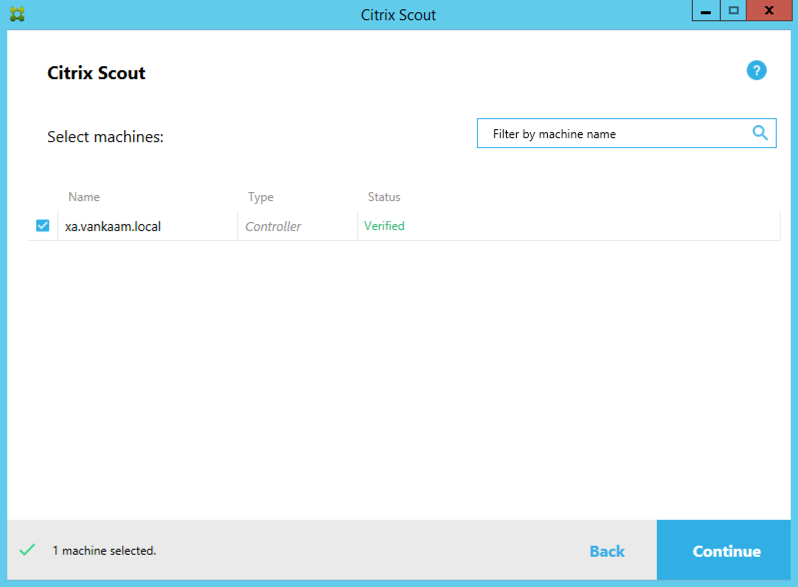
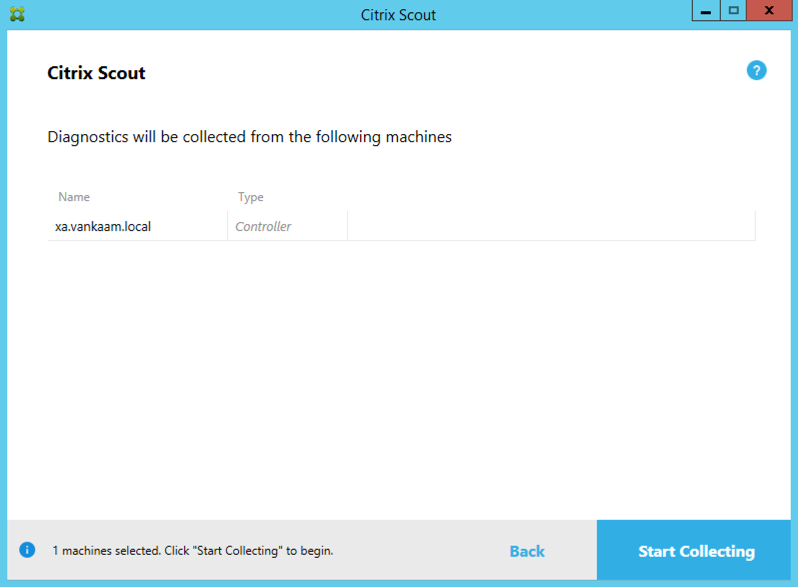
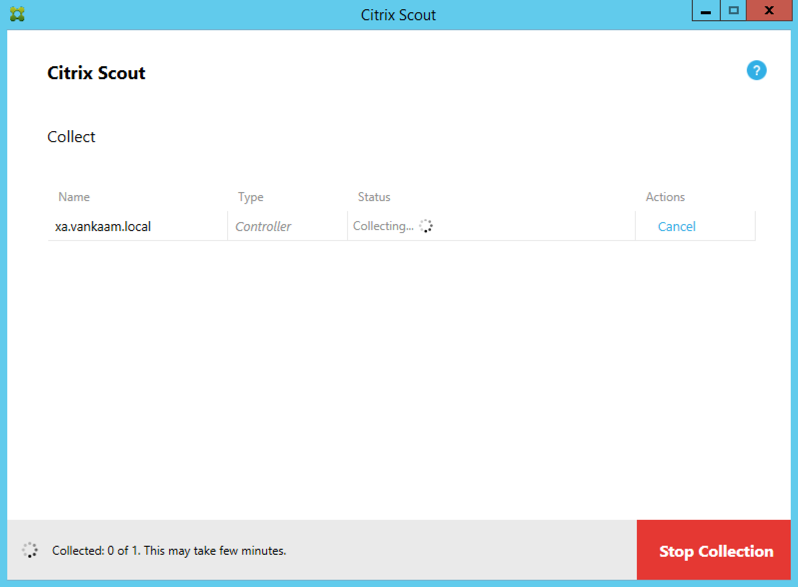
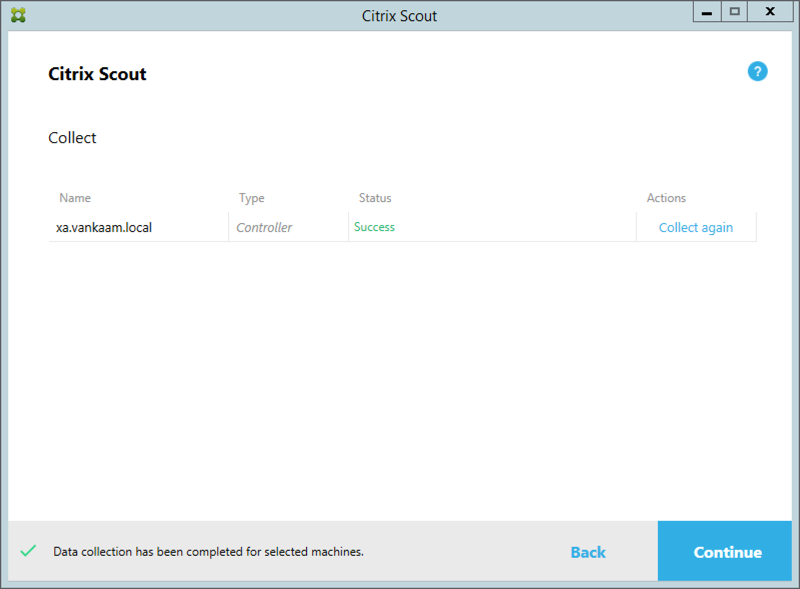
If you are familiar with earlier versions of scout you will notice some huge differences when you first open Scout 3.0 (screenshots can be found near the end of this post). Its interface is very clean and extremely straightforward to use. This, of course was one of Citrix’s main goals: to make it easier for customers to handle/use Scout. As a result, some notable changes have been made ‘under the hood’ and some functionalities have been removed, most of which I will cover here.
- Old – Scout 2.x – One of Scout’s main features is the ability to run so-called CDF traces. When running a trace the idea is that you try and reproduce any issues you might have encountered earlier so that the potential problem can be captured as part of the running trace. In short, when a remote trace is executed, CDF-Control (the stand-alone tool used by Scout to capture CDF-traces) is copied over to the remote machine. Next, the trace runs until it is manually stopped, when finished CDF-Control is deleted from the machine. The captured data/information is stored as configured in the collection settings of Scout.
- New – Scout 3.x – While running traces is still one of Scout’s main capabilities CDF-Control is no longer used for this. Logman.exe (part of Windows) is now used instead. Have a look here, here and here for some more detailed information on how Logman.exe takes care of things. Since Logman.exe is part of Windows it does not need to be copied over when a trace is run remotely, as opposed to CDF-Control mentioned earlier. By default, the maximum (sequential) log size has been set to 500 MB. They looked at the Scout upload history (last couple of years) to determine what would be a good approach. CDF-Control is still available as a separate tool (download here) and is used by Citrix support for more advanced troubleshooting purposes. Of course, it can be used by customers just as easy. The accompanying public TMF files, needed to parse the collected data are also still available for download – for more information on all this read this post. Note that Scout 3.0 also collects AoT (Always on Traces), similar to Call Home: Call Home collects a subset of CDF traces that can be helpful when troubleshooting common failures, for example, VDA registrations and application/desktop launches. This technology is known as always-on tracing (AOT).
If you would like to learn more on CDF tracing in general and how the diagnostic information is ‘pulled’ from the various Citrix components (by CDF-Control) have a look at this post (same as the one before).
As a result, some other changes can be found as well, for example
- Old – Scout 2.x – Within version 2.x you can configure various ‘Collection Settings’. Most of these options have been removed, or at least so it seems. Read on.
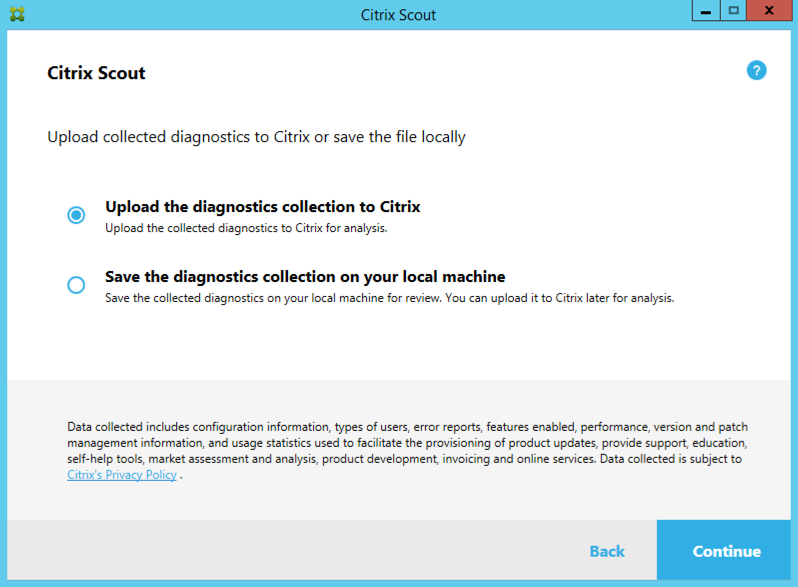
- New – Scout 3.x – Is all about simplifying the user interface. Any configuration changes that might be needed will be exposed throughout the step by step flows, which you will go through when exploring the various options available. Next to that, some of the ‘older’ settings have been removed completely since they are no longer applicable. For example, the ‘Update settings’ option is no longer needed because Scout 3.0 (and upwards) will only be delivered as part of newer XenDesktop/XenApp versions going forward, no more separate download/upgrades. The ‘Report folder’ is no longer applicable, if a user selects “Save the diagnostic collection on your local machine”, he/she can choose where to save the zip file directly. Here it is also optional to upload the collected information to Citrix Insight Services. The ‘Event Log’ is still there but only configurable through an .XML file, no more GUI. You’ll find it here: \Program_Files\Citrix\Telemetry_Service\TelemetryModule\DataPointsConfiguration\MachineDataPoints.xml. By default, the last 2500 log entries of the System and Application event logs are collected/saved – this is also where so-called Key Data points come into play, more on these in a minute. ‘Machine settings’ machines are no longer defined. Technically a user can collect diagnostics data from an unlimited number of machines, though this will be subjected to the amount of resources available. The ‘Proxy server’ is an example of a setting which can be configured when walking through one of the optional flows. As a side note, for more advanced users, some of the above-mentioned default settings can be adjusted/configured in the configuration file: ScoutUI.exe.Config, located at: \Program Files\Citrix\Telemetry Service.
- Old – Scout 2.x – Next to running CDF traces one of the other big features that scout offers is the option to collect Key Data points. See the link below for more detailed information on the type of information gathered.
- New – Scout 3.x – The option to collect Key Data points is still there, though the type and number of Key Data points collected are somewhat different. These are now equal to the Key Data points collected by Citrix Call Home, you’ll find them here.
- Old – Scout 2.x – Next to CDF-Control, which can also be used as a stand-alone tool simply by double clicking it from the utilities folder, Scout is also able to collect data (as part of the Key Data points collection mentioned above) generated by tools like DBDIAG and XDPing. Both are available from the same utilities folder, which can be found here C:\Program_Files (x86)\Citrix\Scout\ Current\Utilities
- New – Scout 3.x – Does not collect data from DBDIAG and XDPing, both tools are no longer part of its ‘repertoire’. Besides that, XDPing has been replaced by the Citrix Health Assistant and all other relevant tools are slowly being moved, or built into Smart Tools going forward.
- Old – Scout 2.x – Contains a utility folder as part of its installation holding the above-mentioned tools like DBDIAG, XDPing and of course CDF-Control.
- New – Scout 3.x – The utility folder is no longer present since none of the earlier highlighted tools will be (directly) part of Scout 3.0.
- Old – Scout 2.x – Has multiple pre-requisites to be able to run Scout locally as well as remotely, have a look at this post.
- New – Scout 3.x – The same pre-requisites still apply plus a couple of additional ones like PSRemoting and Telemetry. More information around the exact pre-requisites that need to be in place will be released shortly.
- Old – Scout 2.x – As part of one of the more specific pre-requisites Scout offers the ability to enable WinRM remotely from its GUI.
- New – Scout 3.x – No longer offers this option. Citrix will use its own documentation to help users enabling it on their environments (it’s specific to Microsoft Operating Systems).
- Old – Scout 2.x – When running a CDF trace all main FMA services are included by default. By manually editing the accompanying .xml files we can exclude FMA services one at the time if/when needed.
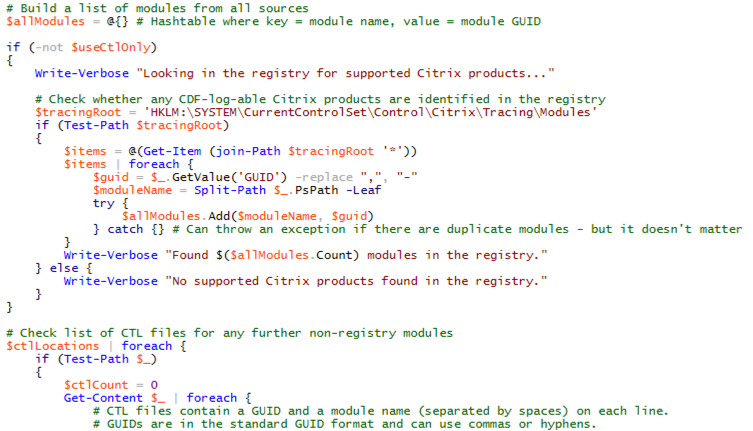
- New – Scout 3.x – Since CDF-Control is no longer used by Scout this approach does no longer apply/work. Instead, (persistent) CDF traces are now collected as described at: https://support.citrix.com/article/CTX200341 (recommended by Citrix ). It will log all (FMA) modules by default, includes all main FMA services by means of a PowerShell script (see image below), which also leverages Logman.exe to log/trace the related CDF data/information. So again, CDF tracing does still apply, though this is now handled by Logman.exe instead of CDF-Control. You can exclude certain models by configuring a blacklist.
Some more details on the CDF tracing methods used
The main thought behind Scout version 3.0 is simplicity, it easier to use not and meant for advanced troubleshooting purposes, per se. As such it should be used as a first line of defence when all basic troubleshoot steps have been taken/looked at. Logman, replacing CDF-Control uses a different approach when it comes to collecting/tracing information (CDF traces included), also known as ETW, or Event Trace Log. It uses so-called providers and CTL files to ‘find out’ or ‘determine’ which information to collect/trace, which will be saved in an .etl type file (CDF-control does the same). You can tell Logman which providers and/or CTL files to use, so you can influence the information traced/logged. Next to that it can also collect data on various performance related counters, and such.
This is where it gets interesting. Although I’ve done some research and I’ve also spoken to a couple of Citrix technicians I’m still not a 100% sure on what I’m about to share next, though I’m probably close to 90 or 95% or so.
We know (for sure) that Logman is used by Scout as well as the above mentioned PowerShell script (CTX200341) though with Scout the starting and stopping of the trace is done manually, while with the PowerShell script it will be persistent, meaning it will run constantly, even after a reboot. However, if, for example you want to run a CDF trace on some, or all of the main FMA services (which were part of a CDF trace by default in earlier versions of Scout) you should now use the PowerShell script instead of Scout – as recommended by Citrix.
Apparently Scout won’t pick up any CDF trace data on the FMA services, or any of the other main FMA components for that matter (or it does, but they prefer a persistent trace instead) while the PowerShell script approach does (assumption). Again, they both use Logman in the background. This is probably because within the PowerShell script all available CDF trace modules/providers are selected by default, and thus it will also include all FMA services etc. (assumption). Remember I told you earlier that you can influence what Logman does and does not trace, at least to some extend. Since Scout is primairily meant for basic troubleshooting purposes I can imagine that it focusses on more basic information to log/trace (assumption). This will probably include data/information on the underlying Operating System as well as a couple of CTX components, but far from all (assumption).
Confused
At first I was a bit confused. If you look at the CTX document (CTX200341) containing the PowerShell script, it continuously mentions persistent CDF tracing. I figured CDF-Control was still used for this, since I was unable to find any information on Logman and CDF data (it’s specific to Citrix) at all. That’s why I kept linking CDF tracing to CDF-Control. I thought that the PowerShell script would use CDF-Control in the background and than Logman to collect the produced .etl files, which I believe is also something it is capable of doing. One of things I did was, I had a look in PowerShell script (see screenshot above as well, it displays less than 10% of the original code) to see if I could find a reference to CDF-Control. But no, Logman was all I could find, which also led me to a couple of the earlier highlighted blog posts around Logman. An educational experience for sure.
I also have to thank Matthew Varghese Erick Verlangieri for helping me out here.
- Old – Scout 2.x – In the current version we can enable the PicaSvc2.exe (an important Desktop VDA service) service to be included (it isn’t by default) into the trace from the Scout GUI, this is no longer possible.
- New – Scout 3.x – Same rules apply here, CDF-Control is no longer used through Scout, this is now handled by https://support.citrix.com/article/CTX200341 as mentioned and explained above.
- Old – Scout 2.x – Can be used to troubleshoot server as well as desktop VDA issues.
- New – Scout 3.x – This still applies, it now includes the earlier mentioned AoT logs as well, more specifically meant to help troubleshoot desktop VDA registration issues. For deeper analyses see the CTX200341 (PowerShell script) approach mentioned above. Of course, the use of CDF-Control on itself is always optional as well.
- Old – Scout 2.x – Next to CDF tracing, Key Data point collections etc. we are also able to manually enable clear text/verbose logging, something which is disabled by default. To enable logging, we need to edit the config .xml files of the FMA services (same as with manually disabling the CDF traces highlighted earlier) In the current version, this can also be done from within Scout for a couple of services.
- New – Scout 3.x – The enablement of clear text/verbose logging is no longer possible from the Scout GUI. When running traces manually, CDF tracing logs are the preferred way to go. Again, have a look at CTX200341 or run a stand-alone CDF trace using CDF-Control. Or just use Scout and see how far it will take you. More often than not you will have Citrix support helping you and/or telling you what to do.
A couple of smaller changes/differences…
- Old – Scout 2.x – Supports XenDesktop 5.x, 7.1 to 7.13, as well as XenApp 6.x, 7.1 to 7.13
- New – Scout 3.x – Only support XenDesktop/XenApp 7.14 and upwards.
- Old – Scout 2.x – Collect data from up to 10 machines at a time.
- New – Scout 3.x – Collect data from an unlimited number of machines – limited to available resources.
- Old – Scout 2.x – Allows diagnostic data to be sent to Citrix
- New – Scout 3.x – Same here.
- Old – Scout 2.x – Allow diagnostic data to be saved locally
- New – Scout 3.x – Possible within 3.x as well.
- Old – Scout 2.x – Does not support Citrix Cloud credentials
- New – Scout 3.x – Support Citrix Cloud credentials is included
Support for Citrix credentials and Proxy server support for uploads is available within version 2.x as well as 3.x
- Old – Scout 2.x – The current version of Scout does not allow for any scheduling
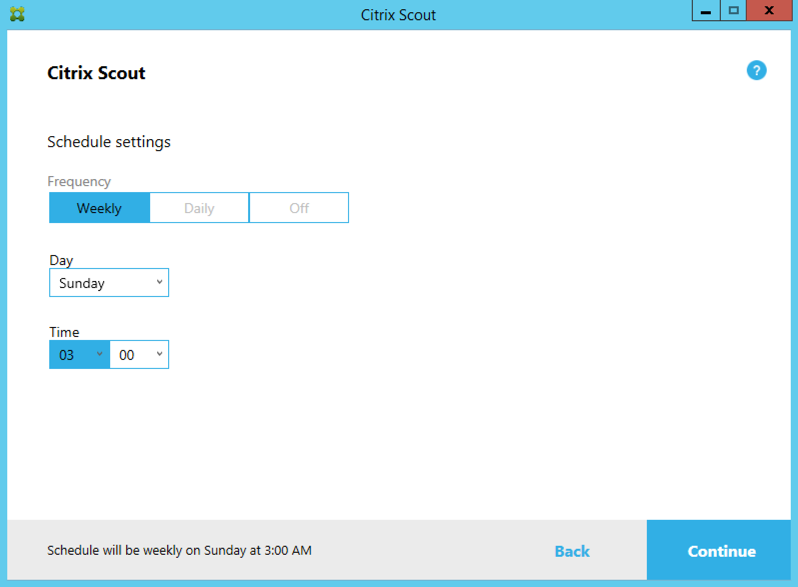
- New – Scout 3.x – Offers the ability to schedule the collection of diagnostic data.
- Old – Scout 2.x – Offers script support from the command-line, but on the local Delivery Controller only.
- New – Scout 3.x – From any machine with Telemetry installed, PowerShell via Call Home commands can be executed.
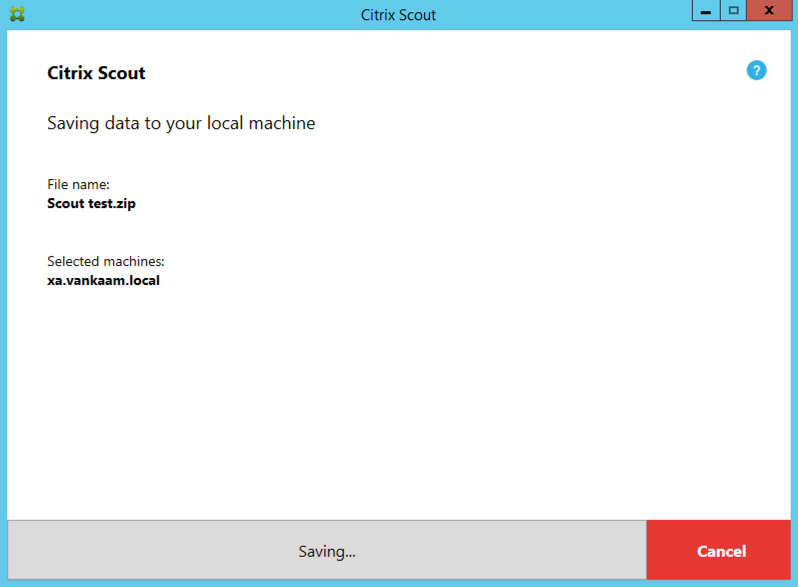
Here’s some Scout ‘art work’ for you to enjoy…
Thanks for reading, hope it helped explain a thing or two.




3 responses to “With XenDesktop & XenApp 7.14 comes Scout 3.0 – some big changes, read what’s new”
[…] Read the entire article here, With XenDesktop & XenApp 7.14 comes Scout 3.0 – some big changes, read what’s new […]
[…] van Kaam With XenDesktop & XenApp 7.14 comes Scout 3.0 – some big changes, read what’s new – compares old Scout with new […]
[…] van Kaam With XenDesktop & XenApp 7.14 comes Scout 3.0 – some big changes, read what’s new – compares old Scout with new […]