Back in November 2015, at the E2EVC conference in Lisbon Bram and Barry first introduced us to their latest and greatest community contribution, the Remote Display Analyzer. And I can tell you, it was very well received *understatement* It seemed that this was something a lot of IT folks were waiting for. Today you have the opportunity to try it out for your self. Read on to learn why this tool will make all the difference when working with and/or troubleshooting the different HDX codes available from Citrix today. Keep an eye on basvankaam.com for any future updates.
In a nutshell
Although the concept behind it might sound simple, I can asure you, the technology is not. The tool is somewhat special; first of all it will show you, which HDX codec is being used including all related and relevant information. Best thing is, it will only take you two mouse clicks (one double click actually) literally. No command prompts, no WMI queries, HDX monitor or Director etc. Secondly, and this is huge, it will let you change display settings on the fly and LIVE switch between the different codecs available, without needing to log out, re-configure, re-boot etc. Framehawk included. You could say it’s an industry first, since even Citrix themselves have not been able to come up with something similar.
All real-time statistics and related information can be viewed using a ‘normal’ user account, no admin permissions needed.
Different codecs
When working with Citrix display technologies, or codecs we have a couple of options to choose from. The policies set and the hierarchy in which those policies apply will determine the graphics mode used. Just as a quick refresher, we have:
- DCR (Desktop Composition Redirection). A.k.a. Direct 3D when viewed in HDX monitor.
- 264 / H.264 Compatibility Mode. A.k.a. Thinwire Advanced when viewed in HDX monitor.
- Legacy Graphics Mode. A.k.a. Thinwire when viewed in HDX monitor.
- Framehawk
I’m not going into any details with regards to what each of these display codecs have to offer and which Operating Systems they do or do not support and so on. Just note that HDX Thinwire, introduced with XenDesktop Feature Pack 3, has recently replaced the mentioned Compatibility Mode. This does tend to confuse people from time to time, me included. Having said that…
Which one is it?
One of the problems today is that, if we look in studio all display policies are mixed together. Another thing that confuses people is that some policies are used for multiple display modes, like adaptive display settings for example, it is used for legacy mode but also for Thinwire compatibility mode. This results in a situation, which is perceived as complex and time consuming to manage, while it doesn’t have to be. Documentation hasn’t always been updated with the “latest” names, which also adds to the confusion. Another problem is that it’s not always easy to find which codec is in use, let alone which settings are applied. Of course we could leverage HDX monitor, either locally installed or through Director, or manually query the various codecs by using WMI queries through a command prompt for example, but that isn’t as straightforward as one would hope. This is where the Remote Display Analyzer truly shines.
The Remote Display Analyzer way, a.k.a. the right and easy way
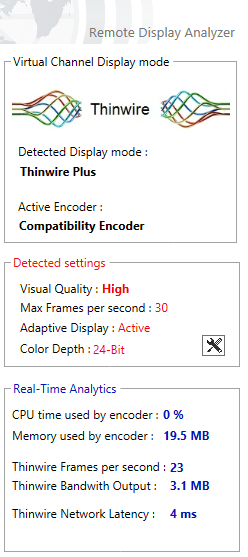
As soon as you start the analyzer from within a remote, or ICA / HDX session the current display mode will be detected right away, a matter of seconds. It will directly show you the current display mode in use, the active encoder, the visual quality, max frames per second and so on, including a bunch of other real-time analytics. This information will all be available in the lite, free version.
But that’s far from all
However simple it may look, although I think they did a great job on the design as well, the technology behind it is quite nifty. Below you will find a short but impressive list of what you as an admin can expect from the Remote Display Analyzer:
- It is meant as a tool for admins, not users. You don’t always need admin permissions though.
- It will give you an (real-time) indication on what the resource consumption is for a specific workload, which might come in handy for troubleshooting.
- It will show you the configured display mode right away, only seconds after launching the tool.
- It will only show you information that matters for the detected display mode, clear and crisp so no (more) confusion whatsoever.
- You can change display settings on the fly, see what works best under which circumstances.
- It is possible to switch between encoders by changing the settings and also possible to switch between DCR and Thinwire.
And I’m sure Bram and Barry will be open to any feature requests you guys might have.
All information shown and changes made at ICA policy level (no changes are made at codec level) is/are fully supported by Citrix. Unless stated otherwise within the Remote Display Analyzer tool itself
Lite and sponsored
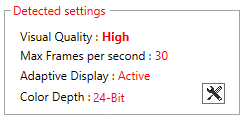
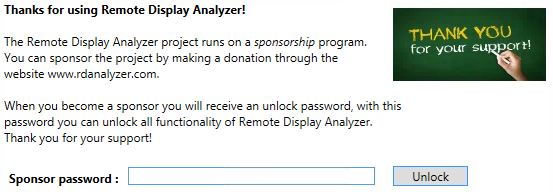
 As mentioned, all real-time statistics and related information will be available in the lite, free version. The more advanced features, like the ability to change display settings on the fly, or live switch between encoders for example, will be available in the sponsored version only. To get access to these features you will first have to click the advanced features icon within the ‘Detected settings’ section as shown on the right. If you are not a registered sponsor already another window will pop up asking you to register as new sponsor before full access will be granted.
As soon as you registered you will have full access to all that the Remote Display Analyzer has to offer. A word of caution on the advanced settings though, these are purely meant for testing and experimenting purposes only, do not apply them in a production environment. Once accessed a warning message will be displayed as well. Have a look below. Due note that I have been testing with a pre-release version, so the screenshots shown will probably slightly differ from the final GA version launched at the 23th of Februari, however, the offered features and functionalities remain the same.
I’ll leave the rest to find out for your selfs. All in all an awesome tool if you ask me!
Make sure to check out their website at www.rdanalyzer.com and follow them on Twitter at @rdanalyzer, or follow them individually. Barry can be found at @barryschiffer and Bram at @bramwolfs
Great job guys and congratulations on your official launch today!
Regards,
Bas.


3 responses to “Presenting… The Remote Display Analyzer!”
Not sure if its just my environment but as soon as I launch it, I’m told that it looks like my session has been disconnected then exits. XA 7.7 Win2K8R2
Hi, I would advise you to seek contact with either Barry or Bram, they should be able to help you out. Regards, Bas.
[…] Remote Display Analyzer lets you see the current codec and change it on the fly. 💡 […]