 When I was thinking about what to write next I thought it might be a good idea to use something ‘from the field’, an issue that I’ve been involved in personally during the past two weeks or so. Then I figured, why just discuss one specific use case when there is so much more to tell. So I won’t, instead I’ll focus on troubleshooting in general and use my ‘real world’ example as a reference throughout this article.
Let’s start with troubleshooting tip Nr 1! Always document what you have done up till a certain point! I know, this is (supposed to be) a no brainer, right? But, and be honest, how many times have you found yourself at the start of a potential troubleshoot session thinking, ok I’ll first have a quick look at the (event) logs, do some googling, carefully read through the corresponding CTX, KB or whatever other article I may find, apply a patch or two, give it a reboot (or whatever) and voila, all good to go, again! Well?!
Ok, I’ll be the first to step up, yes, I’ve been there, and on multiple occasions I might add!
Make sure to check out my book: Inside Citrix – The FlexCast Management Architecture! It includes information from this blogpost and a (whole) lot more! Click here
We have all been there
Unfortunately, more often than not, troubleshooting sessions tend to get out of hand fast. It’s usually a matter of minutes before you find yourself browsing multiple CTX and KB articles at a time, perhaps you’ve posted your issue on one of the Citrix forums and you opened up a support case with Citrix as well, next to that you might be on Twitter, roaming the Linked-In Groups, and if that isn’t enough you’re colleagues start to interfere as well, with all the best intentions off course. Before you know it you have lost track on what’s been done and what still needs to be tried and or tested. Even worse, imagine what happens when you’re off for a few days. Make sure you spend your time off relaxing because when you return you will need at least a whole morning to figure out what they have been up to during your absence. But I guess I’m not telling you something new here right?!
Wait, let’s take a step back first
I think that most experienced system administrators today are more than capable of judging the impact that a certain problem might have or the potential effort that may come with it, or at least to give a rough estimation. If the issue isn’t fixed within, let’s say two to three hours, or if you haven’t come across a ‘most likely’ solution, then it might be a good time to start writing down what you have done so far. Start collecting and start informing your coworkers, and hey, I think your boss would like an update as well. Open up a notepad, either on your desk or desktop and take a minute to reflect on what you have been doing so far. Really, it will only take you a few minutes tops! At this point it might also be a good time to start thinking about opening up a support case with Citrix, if you haven’t done so already. You just collected all the information and steps taken up to this point, so what’s stopping you?
Miracles do happen, do they?
Maybe your problem will just disappear overnight (yeah right) or perhaps you’ll have some sort of an epiphany (an experience of sudden and striking insight, according to Wikipedia, yeah I looked it up) after working hours and all is well in the morning. But what if it’s not, what if you’re still stuck in the morning? Which you probably will be. By making notes you can pick it up right where you have left off and when coworker want to join you in your quest for remediation you can easily show them what has been done, tried and looked at up till that moment, easy peasy! Make a note on any CTX, KB or other articles, forums or blogs you may have gone through or applied, including dates and, if applicable, the names of the coworkers who assisted you during the process.
Learning the hard way
During the past few weeks I had to join a team of Administrators in troubleshooting a XenDesktop 7.x VDA connection issue. I wasn’t involved from the start so I had to dig around a bit to find out what has been looked at and tried up to that point.
 After a day or two they opened up a support case with Citrix as well, but unfortunately that took days, weeks even, before we really got somewhere. Which was kind of disappointing to be honest, I have had better experiences in the past. Sometimes it took take a few days before they replied at all. There seemed to be a time difference as well (no follow the sun apparently), a real treat if you have some questions of your own since getting an answer will take at least half a day, and then there’s… well, let’s just say that you are better of enabling CDF tracing, PortICA and VDA logging on all of your DDC’s, StoreFront servers, a few VDI’s etc. prior to opening up a support case (they should make this mandatory). This way you can upload all gathered logs right away, which will probably safe you around a week or so. We primarily used e-mail as a first communication method but Premier Support 24 x 7 x 365 should apply to that as well right? To be honest I wasn’t sure but I couldn’t find any statement telling me otherwise. So if I missed it, my apologies.
At first it seemed like a reasonably common issue, here’s what we found in one of the VDI’s event logs, running Windows 7 32 Bit streamed by a PVS 7:
Citrix ICA could not configure thin-wire and switch to the remote ICA display. Rebooting the workstation or logging in at the console will fix this.
After digging a bit deeper it turned out that running XenDesktop 7.1 on a vSphere 5.1 hypervisor (latest VMware tools installed) combined with Windows 7 32 bit virtual machines (VDI) streamed with PVS 7 can cause some sort of annoying SVGA WDDM driver issue between Citrix and VMware.
The drawback of it being a reasonably common issue is that there’s a ton of info scattered around the net. And as I joined the party a bit late and nothing was documented I had to find out what had already been looked at, tested etc… but we got there in the end. Have a look at this CTX article, it helped us narrowing down the issue although it’s still not completely gone. Check out this Citrix forum discussion on the issue as well, it’s almost identical to ours. We didn’t end up upgrading to vSphere 5.5, but I can tell you that we’re not far from it, but for reasons other than our issue as well.
Tooling
 As mentioned earlier, I’m not going to discuss our situation in full since we still haven’t got it sorted completely. Instead I’d rather highlight some of the tools available to help us troubleshoot our XenDesktop & XenApp 7.x environments, making life a little easier. Some of which we used as well. I won’t go into any troubleshooting methodologies or anything, I’ll leave that up to you. Just make sure that you have a clear definition on the issue and try to rule out any miscommunications between you and the rest of the team. Also make sure that you understand and know about the underlying architecture, what each component does (or is supposed to do), which services and agents are involved and how they all interact.
Note: I’ll also reference or quote the Citrix.com website where appropriate, since there no need for me to re-describe or re-write some of the options and functionalities available.
XDDBDiag
The XenDesktop Database Diagnostic tool. It was first designed with XenDesktop version 5 but can be used with all new 7.x editions as well. This command line support tool performs a consistency data check on the data and connectivity verification in a XenDesktop database. A great tool to do some pro-active administrating as well. Diagnostic output can be saved in the form of a comma-separated value (.csv) files located in a compressed file (.zip) named computername_XDDBDiag_Output.zip to the same directory in which the program is located. It provides following information:
- Site Information
- Virtual Desktop Agent Information
- Current Connections / Connection Log
- Hypervisor Connections
- Policy Information
- Desktop Group
- Controller Information
- SQL Information and more.
It will automatically search for new updates when launched but this is something that can easily be turned off as well. Check out this article for some more details on how to use it. http://support.citrix.com/article/CTX128075
Legacy alert: Check the following registry key to find some specific connection details: HKLM\SOFTWARE\Citrix\Ica|Session\[n]\Connection Useful when troubleshooting session sharing, for example when users are consuming multiple sessions when they are not supposed to.
XDPing tool
Another command-line tool originating back to XenDesktop version 5 and commonly used to trace and track down connectivity issues. As of version 2.2 the XDPing tool also supports all current XenDesktop 7.x editions. It automates the process of checking for the causes of common configuration issues in a XenDesktop environment. The tool can be used to verify configuration settings on both the XenDesktop Broker and VDA machines, both from the console and remotely. Read through this CTX article to see which command-line options you have when executing the tool, it also includes a short video on how to use it:
http://support.citrix.com/article/CTX123278
It can also monitor and check certain XenDesktop services information and query the local event log to check for known events that are related to XenDesktop. All in all a great tool to handle some of those more common pro-active admin tasks as well.
To give you an idea on how it looks:
https://www.youtube.com/watch?v=NNKFpYlj0Zc
Jack Cobben also wrote an article on it a few years back, you’ll find it here:
http://www.jackcobben.nl/?p=2669
Old school
It’s great that we have such an extensive toolset at our disposal but let’s not forget about the basics. A simple NetStat and/or firewall/port check, a Ping to check network connectivity perhaps, Tracert, Telnet etc… Let’s not forget about those guys shall we?! Are all our services up and running, no errors or warnings, no time or sync issues, a quick and dirty manual event log check, and when you do, remember to check all components that might be involved, your Controller, StoreFront, WebInterface, VDA etc. you get my point right? Of course this kind of functionality is build into most of the tools as well, but sometimes all you need is a simple DOS Prompt and you’re good to go. No separate install or configuration steps needed.
Services and logs overview
With both XenDesktop & XenApp, it is important to understand what is taking place under the covers, which processes and services are involved when enumerating applications, connecting and disconnecting users, provisioning new machines etc. something I’m not going to discuss at this time. Having said that, with XenDesktop we can enable something called service logging, again, assuming you know what you are doing.
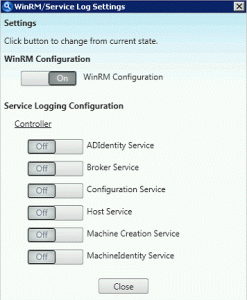 Service logging can be enabled either from the command-line or through Citrix Scout (installed by default on XenDesktop and XenApp 7.5, and up, Delivery Controllers) using a graphical user interface, using Scout will also automate the log folder creation process. Just keep in mind that Scout still lacks the ability to log data for certain services like the Broker Agent, this is the VDA as of version 7.x (an important one), for example. When you enable service logging using the command-line all service will be available. Other services include, the ADIdentity, Broker, Configuration, Host, Machine Identity and Machine Creation services. This is what a manual command-line may look like:
Citrix.MachineCreation.SdkWcfEndpoint.exe-LogFile C:\XDLogs\Name.log
Next to the Delivery Controller (Broker Service log) and the VDA (VDA Broker Agent log) the PortICA service a.k.a. the ICA service (PortICA logging) is probably one of the most important ones to keep an eye on and log information on when troubleshooting connectivity issues. It handles just about everything except for direct communication with the Delivery Controller. Before I continue, all this functionality is build into Citrix scout as well, just so you know.
How to enable VDA Broker Agent logging (not possible using Scout):
http://support.citrix.com/article/CTX117452
This next article sums up the services and agents available for logging, do note that it only applies to XenDesktop version 5.x. As a result some service names have changed with the introduction of XenDesktop 7.x. Like the VDA Broker Agent mentioned in the previous CTX article for example. The rest is still valid though.
http://support.citrix.com/article/CTX127492
PortICA logging, in addition to enabling the VDA Broker Agent log, can be a useful tool when troubleshooting issues with the Virtual Desktop Agent (VDA). PortICA logging is not enabled by default on the VDA. Check out:
http://support.citrix.com/article/ctx118837
HDX Monitor
We all know HDX right? This tool will provide you with detailed diagnostics information on all HDX technologies known today. HDX Monitor version 3.x has been upgraded to also support version XenDesktop version 7.x as well as XenApp 6.5. This CTX article will tell you all you need to know:
http://support.citrix.com/article/CTX135817
Here’s a Citrix Blog on HDX:
http://blogs.citrix.com/2013/06/12/hdx-monitor-3-2-published/
Citrix Scout
As of XenDesktop and XenApp 7.5 Citrix Scout is installed by default. It is a powerful tool that combines, or aggregates, a bunch of the individual tools discussed throughout this article. For example, CDF Control is build into Scout as well and so is XDPing, it also allows you to enable service logging for most of the primary services. But it can do more than that though, it collects data (referred to as Data points) related to the BIOS, the OS installed, Memory information, all sorts of drivers, it also reads certain registry keys, system and application event logs, Site and Farm information, WinRM settings and lot lot more!
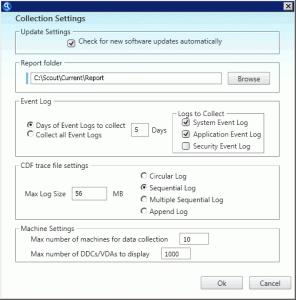 Data needs to be collected before it can be automatically uploaded to Citrix. First you need to select a certain number of machines from which data will be collected, reviewed and eventually uploaded (this is also where Citrix Insight Services, the taas.citrix.com website, comes into play. I mention it near the bottum). You can select up to 10 machines in total. The data will first be analyzed and if any possible corrective actions are found they will be shown on screen giving you the option to execute them. Next you will be asked to choose a location where you would like to store the data in a .zip format. Once the data is saved you will be presented with a dialogue explaining the upload & Analysis process. Click Continue on this to proceed. Than the Upload to TaaS.citrix.com dialog appears, enter your My Citrix Username, password etc. and click Upload.
The status report is sent directly to Citrix Technical Support. An MD5 checksum test is performed to ensure your upload was successful.
This is the CTX article for Scout, it’s full of information. It also lists all so-called Data points mentioned earlier. http://support.citrix.com/article/CTX130147
CDF Control
CDF stand for Citrix Diagnostic Facility, it has been around for over 7 years and it’s still one of the most used diagnostic toolkits used today! While build into Citrix Scout it’s also available as a stand-alone download and fully supports all new XenDesktop Editions. It is an event tracing controller/consumer, geared towards capturing Citrix Diagnostic Facility (CDF) trace messages that are output from the various Citrix tracing providers. Note that you will need to have local admin permissions to be able to start tracing. Here’s where to get it and how to use it: http://support.citrix.com/article/CTX111961
Consider it to be a good practice to try and collect some CDF traces prior to opening up a support case with Citrix, since this is probably one of the first things they’ll have you do, unless you are in doubt on where to start of course.
Policies: Check Active Directory and IMA based policies by using policy modeling and or group policy results. Depending on your configuration run these tools either from Studio, an active Domain Controller or both.
Citrix print detective
 This tool has been around for a few years now and as of version 1.2.1.5 it also supports XenDesktop 7. Print Detective is an information gathering utility that can be used for troubleshooting problems related to print drivers. It enumerates all printer drivers from the specified Windows machine, including driver specific information. It can also be used to delete specified print drivers. It allows for log file capabilities and provides a command-line interface as well. It supports all of Microsoft’s desktop and server platforms, although I’m not sure on Windows Server 2012, I think it should work though. How to use print detective? Go to:
http://support.citrix.com/article/CTX116474
Citrix Director
Known by most, but for those of you who are still unfamiliar with Director, have a look at this Citrix E-Docs page , it includes an introduction video:
http://support.citrix.com/proddocs/topic/xenapp-xendesktop-75/cds-monitor-director-wrapper.html
Director has two separate views depending on your permissions, a Helpdesk view and an Administrative view. It goes without saying that the Administrative view hands us some additional features to work with. It offers historical views with data storred ranging from a single hour, 24 hours or 7 days in total. On the Administrative dashboard it displays the average time it takes for users to logon (which can also be vieuwed on a per user basis), how many sessions are active, if there are any failed machines and or connections, if your Delivery Controllers are up and running and more.
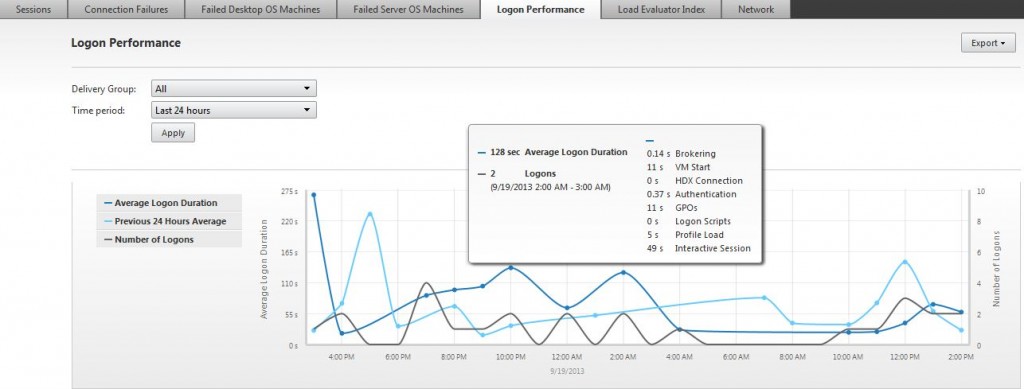
On a more granular level you can get specific ‘per user’ information: which processes are currently loaded, how HDX is doing, applications launched, the name of the VDA, how much memory and CPU resources are in use, which policies are applied etc. You can also send remote messages and power off or shut down a machine remotely. Shadowing user sessions is now also done directly from Director. By using different kinds of filters you can change the type of information displayed including detailed overviews on the current active or disconnected sessions. As mentioned, logon performance can be viewed overall or on a per user basis, and as you can see in the screenshot it shows very detailed information with regards to what is going on during the logon process, very usefull.
PowerShell
 PowerShell is another great example of a toolkit that can be used proactive as well as reactive when it comes to checking up on certain crucial infrastructural services. For example, there are a whole bunch of PowerShell ‘Get’ commands available that will quickly and easily show us how our current infrastructure is doing. I think every company should make use of this and make it part of a daily infrastructure check. Here are some of the most commonly used Get commands:
Get-BrokerServiceStatus (Broker), Get-SFServiceStatus (StoreFront), Get-HypServiceStatus (Host service), Get-ConfigServiceStatus (Configuration), Get-AcctServiceStatus (AD Identity).
Of course there is a whole lot more that you can do using PowerShell, everything you do using XenDesktop Studio for example can be done using PowerShell scripts as well. In fact, everything you configure using Studio is actually PowerShell being executed in the background. It is very tightly integrated, which is a good thing! Studio sort of records all of your manual configuration steps and turns them into PowerShell scripts for you to copy and perhaps reuse.
Here is some additional info from the Citrix E-Docs website:
http://support.citrix.com/proddocs/topic/xenapp-xendesktop-75/cds-sdk-wrapper-rho.html
Citrix (XenDesktop) Studio
Studio is the main console used for managing users, applications, delivery groups, machine catalogs and reporting, plus it can also be used to do some basic troubleshooting. It doesn’t really have any diagnostic capabilities but it can quickly show you how many machines are actively being used, the number of users connected and applications in use. Of course it can also be used to disconnect sessions and reboot virtual as well as physical machines. It also has an alert and notifications section worth having a look at. Together with Director, Studio functions as your fist line of defense against unwanted errors and warnings.
Citrix Insight Services
Insight Services is the glue binding it al together, here you can upload your log and trace files and link them to any support cases you might have registered earlier. Once you upload a file Insight Services will automatically analyze your log files and scan them for hundreds of know issues. From their website: Citrix Insight Services reads log files from XenDesktop, XenServer, XenApp, NetScaler, PVS, ByteMobile, XenMobile, CloudBridge, CPBM and XD/XA Connector, and we’ll be adding products to it over time.We’re adding new plug-ins that capture known issues for these products all the time. So Citrix Insight Services will keep getting better.
When Citrix Insight Services discovers any known issues in your environment, it suggests hot fixes, patches and updates with red/yellow/green prioritization. It will also analyze your configuration and give you best-practice advice, with links to relevant articles or white papers. Citrix Insight Services isn’t just for troubleshooting. It’s also a great way to give your system a quick Health Check, so you can spot any issues before they become real problems. Check it out here:
https://taas.citrix.com/AutoSupport/howitworks/
A global overview (no details)
To finalize as far as troubleshooting tools go, here’s an overview on all tooling Citrix has available. It only lists the tools and their accompanying CTX articles, it doesn’t say anything on the supported editions of XenDesktop & XenApp or in some cases Provisioning Services and WebInterface or StoreFront.
http://support.citrix.com/article/CTX126294
Conclusion
I think it’s safe to state that Citrix offers a great set of tools to troubleshoot our current as well as our more legacy environments. Their tool set has improved and matured over time and it’s good to see that Citrix keeps investing time and effort into developing new tools and initiatives like Citrix Insight Services, which isn’t new, I know, but still! And what about the PowerShell integration?! About my comments on Citrix support earlier, I can only say that I’m not here to bring them down or anything, I just like to keep them on their toes :-) I hope this article has been as informative as it was fun to write. Thanks again for reading!




11 responses to “Troubleshooting Citrix XenDesktop & XenApp 7.x ? Read this !”
Great article! I have to totally echo your comments about the quality of Citrix support lately. It’s gone way downhill and if you don’t have every log known to man then you can expect to spend 2-3 calls with them asking for more logs.
Hi Paul, thanks!
Hello Bas, Great article.. Momentary i am working on a Monitoring & Maintaining Citrix Environment blog post myself…
That’s great Igor, I’m looking forward to reading it!
Citrix has really worked hard on improving the diagnostic facilities and on the other hand Bas has worked equally hard in giving a great write up of each diagnostic tools. Kudos to both!! Great stuff Bas!!
Thanks a lot!
Hello from México, great article, always is interesting and educational read your blog.
Thank you very much!
many thanks for the article admin
i have been searching for these articles
helped me alot…………thank Q
Glad I could help! Have a nice weekend.
Citrix Xenapp And Xendesktop Help Desk Support
[…] imes it took take a few days before they replied at all. There seemed to be a ti […]