 If you recall, and I think you do, last week I published an article / guide, named: The ultimate IOPS cheat sheet, which, I’m glad to report, was an instant success! For those of you who might have missed it you’ll find it here. Throughout the article / guide I talk about what IOPS are, how and why they impact overall performance, how they can be measured and (a lot) more. However, as you’re probable well aware, there is more to it then ‘just’ IOPS and the underlying disk subsystem when it comes to measuring or validating (benchmarking) overall performance with regards to our VDI and or HSD orientated architectures. Although they (IOPS) do make up a large piece of the puzzle, we also have to deal with CPU, memory, networking and more.
Intro continued…
We need to consider, not only the number of users, or potential active sessions, but also the types of workloads that they will be using. On an even more granular level we would like to know how much CPU, RAM and IO is being consumed per application, per process (opening, closing, compressing, copying etc.) and overall with all guns blazing. How long it takes for a user, or session, to log on, or an application to start up, are some other examples of data we want to be able to examine. I’m not sharing any secrets when I say that Login VSI is the industry standard performance validation solution for centralized virtualized desktop and server-based environments.
Introduction to Login VSI
Let me start by (partially) quoting Login on their own product. The philosophy behind Login VSI is different to conventional benchmarks. In general, most system benchmarks are steady state benchmarks. These benchmarks execute one or multiple processes, and the measured execution time is the outcome of the test. Simply put: the faster the execution time or the bigger the throughput, the faster the system is according to the benchmark.
 Login VSI is different in approach. Login VSI is not primarily designed to be a steady state benchmark (however, if needed, Login VSI can act like one). Login VSI was designed to perform benchmarks for SBC or VDI workloads through system saturation. Login VSI loads the system with simulated user workloads using well known desktop applications like Microsoft Office, Internet Explorer, Adobe PDF reader and more. By gradually increasing the amount of simulated users, the system will eventually be saturated. Once the system is saturated, the response time of the applications will increase significantly. This latency in application response times a clear indication whether the system is (close to being) overloaded. As a result, by nearly overloading a system it is possible to find out what its true maximum user capacity is.
VSImax explained
After a test is performed, the response times can be analyzed to calculate the maximum active session/desktop capacity. Within Login VSI this is calculated as VSImax. When the system is coming closer to its saturation point, response times will rise. When reviewing the average response time it will be clear the response times escalate at saturation point. This VSImax is the “Virtual Session Index (VSI)”. With Virtual Desktop Infrastructure (VDI) and Terminal Services (RDS) workloads this is valid and useful information. This index simplifies comparisons and makes it possible to understand the true impact of configuration changes on hypervisor host or guest level.
The simulated workloads are executed directly on the target systems within the session, as apposed to using remote sessions. The benchmark overhead and footprint is small, 1-5 %.
Check out the link below if you want to know more about how these tests are being conducted and how the data is analyzed. It includes information on Login VSI version 4.0 as well as the newly announced 4.1 product.
So what’s new with version 4.1?! Mark Plettenberg, Product Manager at Login VSI:
Login VSI 4.1 delivers significant improvements that help organizations more easily predict and validate the performance of their constantly changing virtual desktop environments. Because Login VSI makes large-scale performance testing easy, even organizations with the most complex virtualized environments choose Login VSI to integrate in their operational test cycles to safeguard the performance and user experience.
New highly realistic workloads
Version 4.0 included three different workloads, which we came to know as Light, Medium and Heavy. As of version 4.1 they have introduced a new workload known as the Office worker and at the same time they redefined the definition of the workloads in the previous version mentioned above. These are now know as: Task worker, Knowledge worker and Power worker. The earlier mentioned Office worker sits in between of the Task and Knowledge worker profiles.
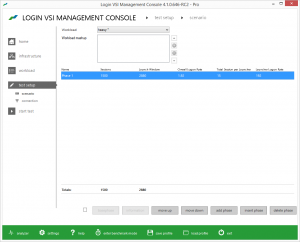
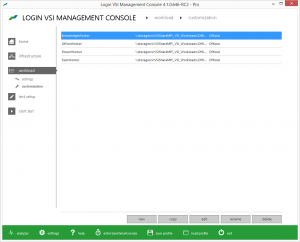 Starting with the lightest load, the Task worker and Office worker are based on 1vCPU desktops, the Knowledge and Power worker are both based on 2vCPU desktops. According to Login VSI these new workloads will allow organizations to better match and simulate their virtual desktop usage and predict and validate the performance of constantly changing production environments.
Performance data from any source
You are now able to import data generated by Microsoft Windows Performance Monitor, VMware ESXtop, or any other data source in CSV format into the Login VSI Analyzer. This allows you to examine the performance data from the operating system, hypervisor and the underlying disk sub system(s) in great detail, see how they interact and easily indentify any performance bottlenecks that may exist. The Login VSI analyzer uses a build-in automatic scaling and time synchronization mechanism for this, I don’t have any more technical details at the moment.
It’s even more simplified
Companies that would want, or need, to test without Microsoft Office are now better of as well. The new versatile VSImax measurement and calculation methodology does no longer specifically dependent on Microsoft Office Word, which add to it’s overall flexibility. Version 4.1 also includes some new VSImax measurements which help indentify specific bottlenecks such as CPU or disk IO. In short, it’s more precise and powerful than ever!
A few examples, metrics related to resources
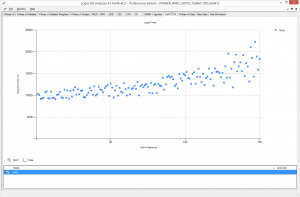
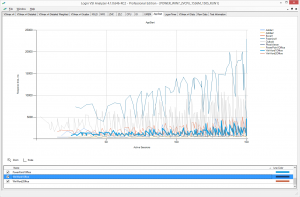
Below you will find a few examples on how Login VSI measures per application and per session performance. It includes multiple abbreviations (made up and used by Login) of the applications and actions measured, including some detailed information and related physical resources that are actually being inspected. I also included some screenshots on the so called Logon Timer and App Start metrics.
I think it’s safe to state that Login has once again improved their already complete benchmark stack, any feature requests perhaps? In terms of use the official public release of Login VSI 4.1 is scheduled for the 5th of August 2014, so it won’t be long now!
Current Login VSI Pro customers can upgrade at any time! Or… Get your free 20 days trial license here, top right corner: http://www.loginvsi.com


