Citrix Director
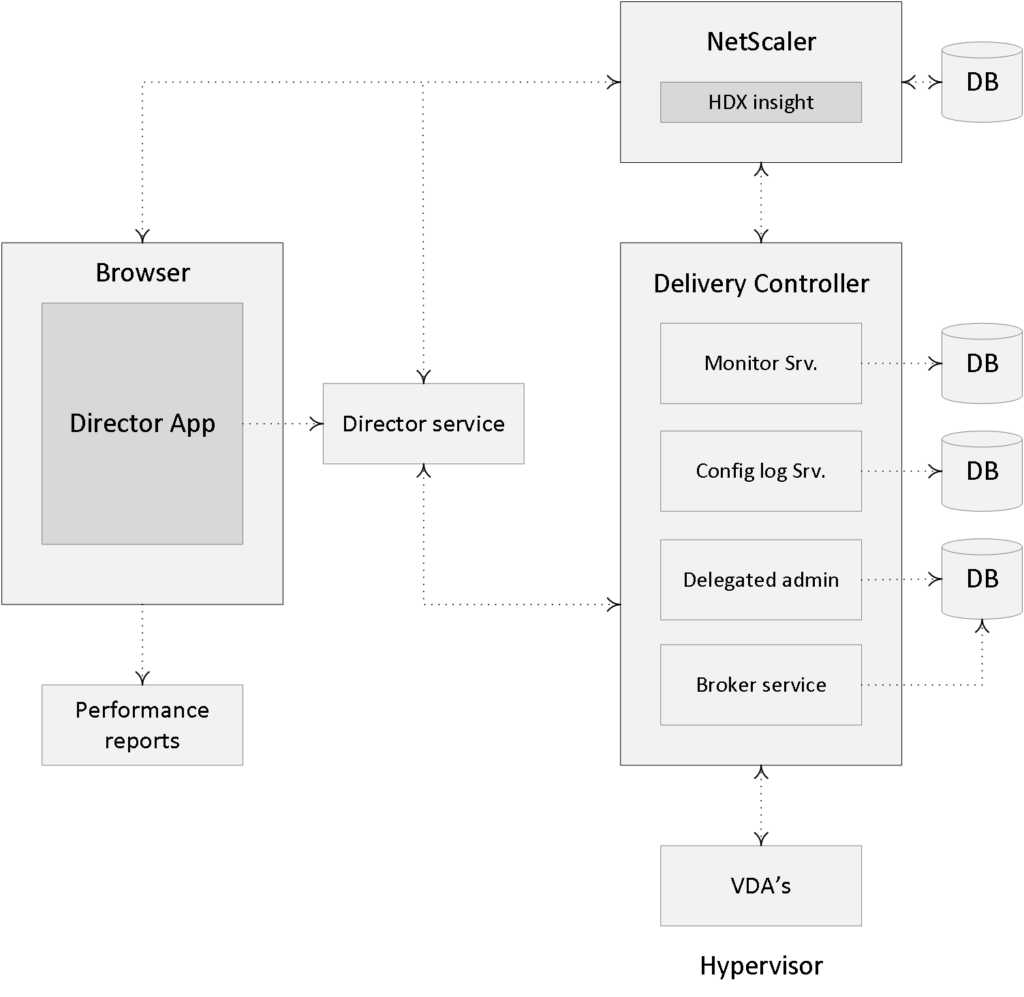
Director is a real-time web-based tool (can be installed as a website on your Delivery Controllers) that allows administrators to monitor, troubleshoot (real-time as well as historical) and perform support tasks for their end-users. It is Citrix’s first line of defense and it is, by default, included with all editions of XenDesktop and/or XenApp, although higher editions do offer some additional functionality. As of XenDesktop 7.x it has some of the former EdgeSight functionality built in (historical reporting mainly) and if you own the proper licenses (Platinum) for both XenDesktop and NetScaler you can monitor your NetScalers (HDX Insight) using the same console as well.
The idea behind this project? Before commenting, read the introduction blog post here
Performance and monitoring data
By default, Director has access to:
- Real-time data from the Broker Agent using a unified console integrated with EdgeSight features, Performance Manager, and Network Inspector.
- EdgeSight features include performance management for health and capacity assurance, and historical trending and network analysis, powered by NetScaler HDX Insight, to identify bottlenecks due to the network in your XenApp or XenDesktop environment.
- Historical data stored in the Monitor database to access the Configuration Logging database.
- ICA data from the NetScaler Gateway using HDX Insight.
- Gain visibility into end-user experience for virtual applications, desktops, and users for XenApp or XenDesktop.
- Correlate network data with application data and real-time metrics for effective troubleshooting.
- Integrate with XenDesktop 7 Director monitoring tool.
- Personal vDisk data that allows for runtime monitoring showing base allocation and gives helpdesk IT the ability to reset the Personal vDisk (to be used only as a last resort).
- The command-line tool CtxPvdDiag.exe is used to gather the user log information into one file for troubleshooting.
Source: Citrix E-docs website
FMA fact: Make sure to check out CTX139382 for a whole bunch of best practices around Director.
As already briefly highlighted, Director makes use of Citrix’s EdgeSight technology, which is now an integral part of Director. However, not that long ago, it was still available as a separate product offering the ability to monitor applications, devices, sessions, license usage, and the network in real time, allowing users to quickly analyze, resolve, and proactively prevent problems. The latest version that was released was 5.4.
While EdgeSight(reporting)was very powerful it was also quite complex to operate and work with. Today Director probably covers up to 80 – 90% of all tasks needed by first as well as second line support engineers and at the same time it is very easy and straightforward to navigate. As you might recallCitrix Director started out as a fairly simple monitoring and troubleshooting tool only capable of offering real-time support.
As time progressed people started asking for historical reporting features as well as trend analysis capabilities, and rightfully so. This is where the earlier mentioned EdgeSight functionality comes in. They reused and have re-written part of the original code and primarily focused on the reporting functionality now available in Director, as we know it today.
FMA fact: As it stands today, the EOL for EdgeSight has been set to 30-June-18, or 24-Aug-2016, depending on if you have a valid software maintenance and/or Subscription Advantage. In that case, the EOM is set to 31-Dec-17 or 24-Feb-2016.
While Director will be shipped with every XenDesktop / XenApp version, offering real-time assessment and troubleshooting capabilities, the additional reporting and trends analysis functionality does require a Platinum license for both the XenDesktop and/or XenApp, depending on which product you are using. The same applies to the network analysis functionality; you will need at least a NetScaler Enterprise or Platinum license for this. With an Enterprise license you will be able to store historical data for 60 minutes, while with a Platinum license there is no limit.
Made possible with the support of my sponsor IGEL
The ability to view historical data/reports, including trend analysis can be very helpful when troubleshooting your XenDesktop / XenApp deployment. Since the data storage restrictions for XenDesktop / XenApp are slightly different per platform license, I’ll summarize them below:
- All editions: Will have free use of Director troubleshooting and real-time monitoring with data storage for up to 7 days (data will be groomed after 7 days).
- XenDesktop 7.x Platinum: In addition to the above the Platinum license offers the performance management feature including historical monitoring of data for up to a full year, which will be stored in the Configuration Logging database. By default data will be groomed at 90-day This can be changed up to 367 days by means of a PowerShell applet. Run: Set-MonitorConfiguration to change the default grooming settings.
- XenDesktop 7.x Platinum plus NetScaler Enterprise: In addition to the above, the NetScaler Enterprise license offers networking analysis plus 60 minutes of data storage max.
- XenDesktop 7.x Platinum plus NetScaler Platinum: Offers the exact same functionality as above but with the added advantage of unlimited data storage. Note that this is tested, and thus officially supported by Citrix up to three years.
Using the standard Director reporting feature you will have direct access to information like: the peak number of sessions during the last month, the average user logon duration time (current and historical), device registrations failures during the last couple of days, weeks, months and more.
While using Director gives us access to a ton of information, it is impossible to include everything. Another option you have is the so-called Monitor Service OData API. This can be used to create custom reports for analyzing purposes. It is all about getting the information out of your database and converting it to a, for us humans, readable format. And while this may sound complex, it doesn’t have to be. In fact, all you need is Microsoft Excel. Using the Open Data (OData) protocol you basically let Excel directly communicate with your Delivery Controller. Have a look at the following Citrix blog post for some more detailed information on how to set this up:
Views and delegated administration
Director offers different interface views, which are or can be tailored to the various administrative roles and responsibilities available within Director. This way you can limit the amount of information and data available to Helpdesk Support Technicians, while Site Administrators might have full access to all that Director has to offer.
Director also has various built-in administrator roles for this purpose, ranging from full administrator to host or Machine Catalog administrator, for example, and a few in between. You also have the ability to configure your own custom admin roles, Studio Delegated Administration is based on three concepts: administrators, roles, and scopes.
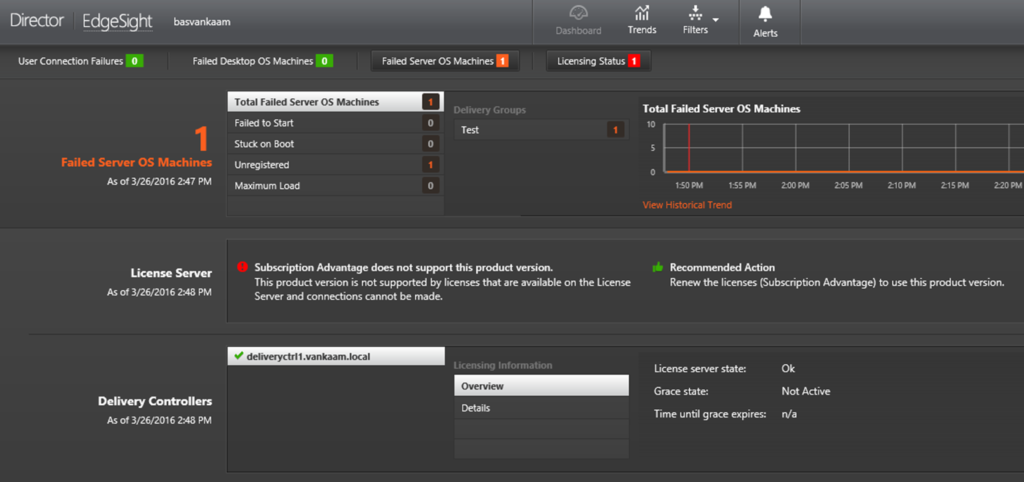
When it comes to monitoring your XenDesktop / XenApp Sites Director has a lot to offer. Take the default Dashboard view, shown when you first log into Director. Depending on your license type it will show you the following information:
- Any connection failures that may have taken place.
- Failed desktop OS machines and/or any failed server OS machines.
- The actual license status.
- The number of currently connected sessions.
- The average user logon duration.
- Infrastructure health. Here it will keep an eye on your Delivery Controllers, including any Hypervisor hosts that might be used as well.
From here you can easily drill down further by simply clicking one of the highlighted failures if any. You can also click one of the statistics numbers shown on the Dashboard or select a predefined filter from the Filters menu; the Filter view will then open to display all data based on the selected machine or failure type. The Trends view will access historical information on sessions, connection failures, machine failures, logon performance, and load evaluation for each site. When further inspection is needed here are some of the options you have using the Trends view:
- You can export all graphical data to a .PDF, Excel or .CSV file.
- View trends for sessions.
- View trends for connection failures.
- View trends for machine
- View trends for logon performance.
- View trends for load evaluation.
- Hosted application usage.
- Desktop and server usage.
- Virtual machine usage.
- Network analysis data using HDX I
- And more.
To further troubleshoot and/or manage any potential issues, you can control the state of a machine in various ways. These include:
- Start, restart and forced
- Shutdown and forced
- Suspend and résumé.
If you further drill down into the machine details (using the machine details view) Director can also show you any hotfixes that might have been installed on the VDA, physical and/or virtual. Another option would be to put a machine in maintenance mode so that no further connections are possible.
FMA fact: As of version 7.7 Director can be configured to make use of integrated Windows authentication so that domain-joined users gain direct access to Director without re-entering their credentials on the Director logon page.
Director main dashboard
Director offers us various ways in which alerts can be viewed and displayed. For example, the main dashboard Director shows us critical alerts and warnings, which are updated every minute by default. An overview of all alerts can be viewed by selecting ‘Alerts’ at the top of the Director page, more granular information on a per alert basis can be viewed by selecting one of the alerts shown on the main dashboard directly or by selecting ‘Go to Alerts’ at the bottom of the Director page when viewing current alerts and warnings. An orange triangle tells us that a minimum threshold of a condition has been reached, and a red circle tells us that the maximum value of the threshold has been reached.
Director allows you to manually configure multiple Citrix Alerts policies. When defining the various thresholds you can also configure notifications to be sent by email to individuals and groups when alerts meet and exceed the thresholds you have set up. You have over ten policy conditions to choose from.
As of XenDesktop / XenApp version / Director 7.7 you can integrate SCOM alerts directly into your Director interface. Note that at the time of writing the integration will only support SCOM 2012 R2. Any alerts generated by SCOM will be directly visible within Director at the same locations as with the configurable Citrix alerts mentioned earlier. The SCOM alerts will include the severity, time raised, name and source.
To find out any details regarding a specific alert all you have to do is click on it and more detailed information will be displayed. If you go to the ‘Alerts’ section directly, you will find a separate tab dedicated to SCOM alerts as well, here you will be able to filter all SCOM alerts based on the management pack used, machine source, severity and a preconfigured time period. As a final note, all alerts information can also be exported to .PDF, .CSV and/or Excel files if needed.
FMA fact: The actual SCOM web interface can be launched from within Director as well. You will find it on the ‘Alerts’ page.
In addition to the above, I am (pretty) sure you guys have heard about the Comtrade SCOM management pack acquisition by Citrix not too long ago. The following (SCOM) packs will be available exclusively from Citrix: XenApp, XenDesktop, NetScaler, XenMobile, ShareFile, XenServer, StoreFront, Web Interface, Provisioning Services, License Server and CloudBridge. Note that, as it stands today, the abovementioned management packs will only be available for Platinum XenDesktop and XenApp customers.
This comes from one of the Citrix blogs over at Citrix.com/blogs covering the Comtrade acquisition:
The SCOM packs integrate Director’s helpdesk capabilities and add detail for admins to monitor their infrastructure and workloads, all from a single pane of glass. And the latest version of Director can also aggregate SCOM alerts into the helpdesk dashboard for enhanced troubleshooting. Additional value using SCOM packs with Director include:
- End-to-end Citrix infrastructure monitoring, including XenApp, XenDesktop, StoreFront, Web Interface, Provisioning Services, License Server, XenServer, NetScaler, and CloudBridge.
- Aggregate health overviews across multiple sites and versions with SLA dashboards.
- Advanced monitoring of applications, delivery groups, and sites.
- Advanced user experience monitoring, with expanded alerts, for logon and session performance.
- Launch Director within the management pack GUI to drill into user sessions from SCOM alerts.
- Topology views with detailed relational information.
As of XenDesktop / XenApp version 7.8 you can now access Citrix Insight Services from a drop-down menu in Director, providing you access to additional diagnostics information. Insight Services (check: cis.citrix.com) collects data from multiple sources, which include Citrix Scout and Call Home services.
Citrix Call Home performs periodic collections of your systems and product configuration, plus performance, error, and other information. This information is then sent over to Citrix Insight Services for proactive analysis and resolution. This is where the FMA analytics service plays a key role.
FMA fact: Director can also be used to monitor and troubleshoot IMA-based architectures in the form of XenApp 6.5. Features include but are not limited to Shadow sessions, Machine details pane, HDX panel, Delegated Administration support, and Activity Manager for 6.5.
Citrix Director is another example of one of Citrix’s products which is under constant development: it is being improved faster than I can write, but hopefully, this chapter will at least give you an indication of its added value. It continues to grow and gets better and better with each new version.
- Director is a real-time monitoring and troubleshooting web-based tool.
- Citrix EdgeSight technology has been built into Director (primarily used for historical data reporting, trends, and analyses). The EdgeSight software will no longer be available as a separate product. The latest version of EdgeSight was 5.4, which is still supported until 31-Dec-17 if you have a valid software maintenance and/or Subscription Advantage.
- To be able to make use of the built-in historical reporting functionality Platinum XenDesktop / XenApp licenses will be needed.
- To make use of the network analysis functionality you will need to have at least a NetScaler Enterprise or Platinum license.
- Depending on your XenDesktop / XenApp / NetScaler licenses, you will be able to store historical data for a certain period of time. See the overview.
- Director offers different views for administration and troubleshooting purposes, including the ability to configure delegated administration on a per-role basis.
- Alerts and notifications are directly visible and accessible from the main dashboard.
- The main XenDesktop / XenApp infrastructural services are also being monitored by Director, these are visible from the main dashboard view. It uses PowerShell for this.
- SCOM alerts and notification can be configured and viewed from Director as well. Just recently, Citrix acquired the SCOM Comtrade management packs for Citrix environments.
- Insight Services can now be accessed directly from Director. It is fuelled with analytics data from Scout, as well as Citrix Call Home.
- Insight services can also be accessed directly by going to www.cis.citrix.com.
- Director can also be used with IMA, XenApp 6.5 based environments. It supports ‘older’ VDA


